The liquidity of Barcelona's property market: what sells first and where
Knowing how much a property is worth is important. But knowing how long it takes to sell can be even more decisive for owners, investors and professionals in the sector. That is the key to the concept of property liquidity: how much an asset moves within the market.
Based on data processed by Accumin Intelligence, which analyses the duration of listings on portals and the absorption rate in each area, it is possible to classify the residential stock into five levels of liquidity: A (very high liquidity), B, C, D and NL (non-liquid). This analysis, now applied to Barcelona, allows us to read the market in greater depth: to understand which areas have the highest turnover, which types of housing come off the market first, and which segments show signs of stagnation.
The post is accompanied by maps and visual graphs, which show the complete structure of the housing stock according to location, size and type.
Majority liquidity, but with contrasts by district
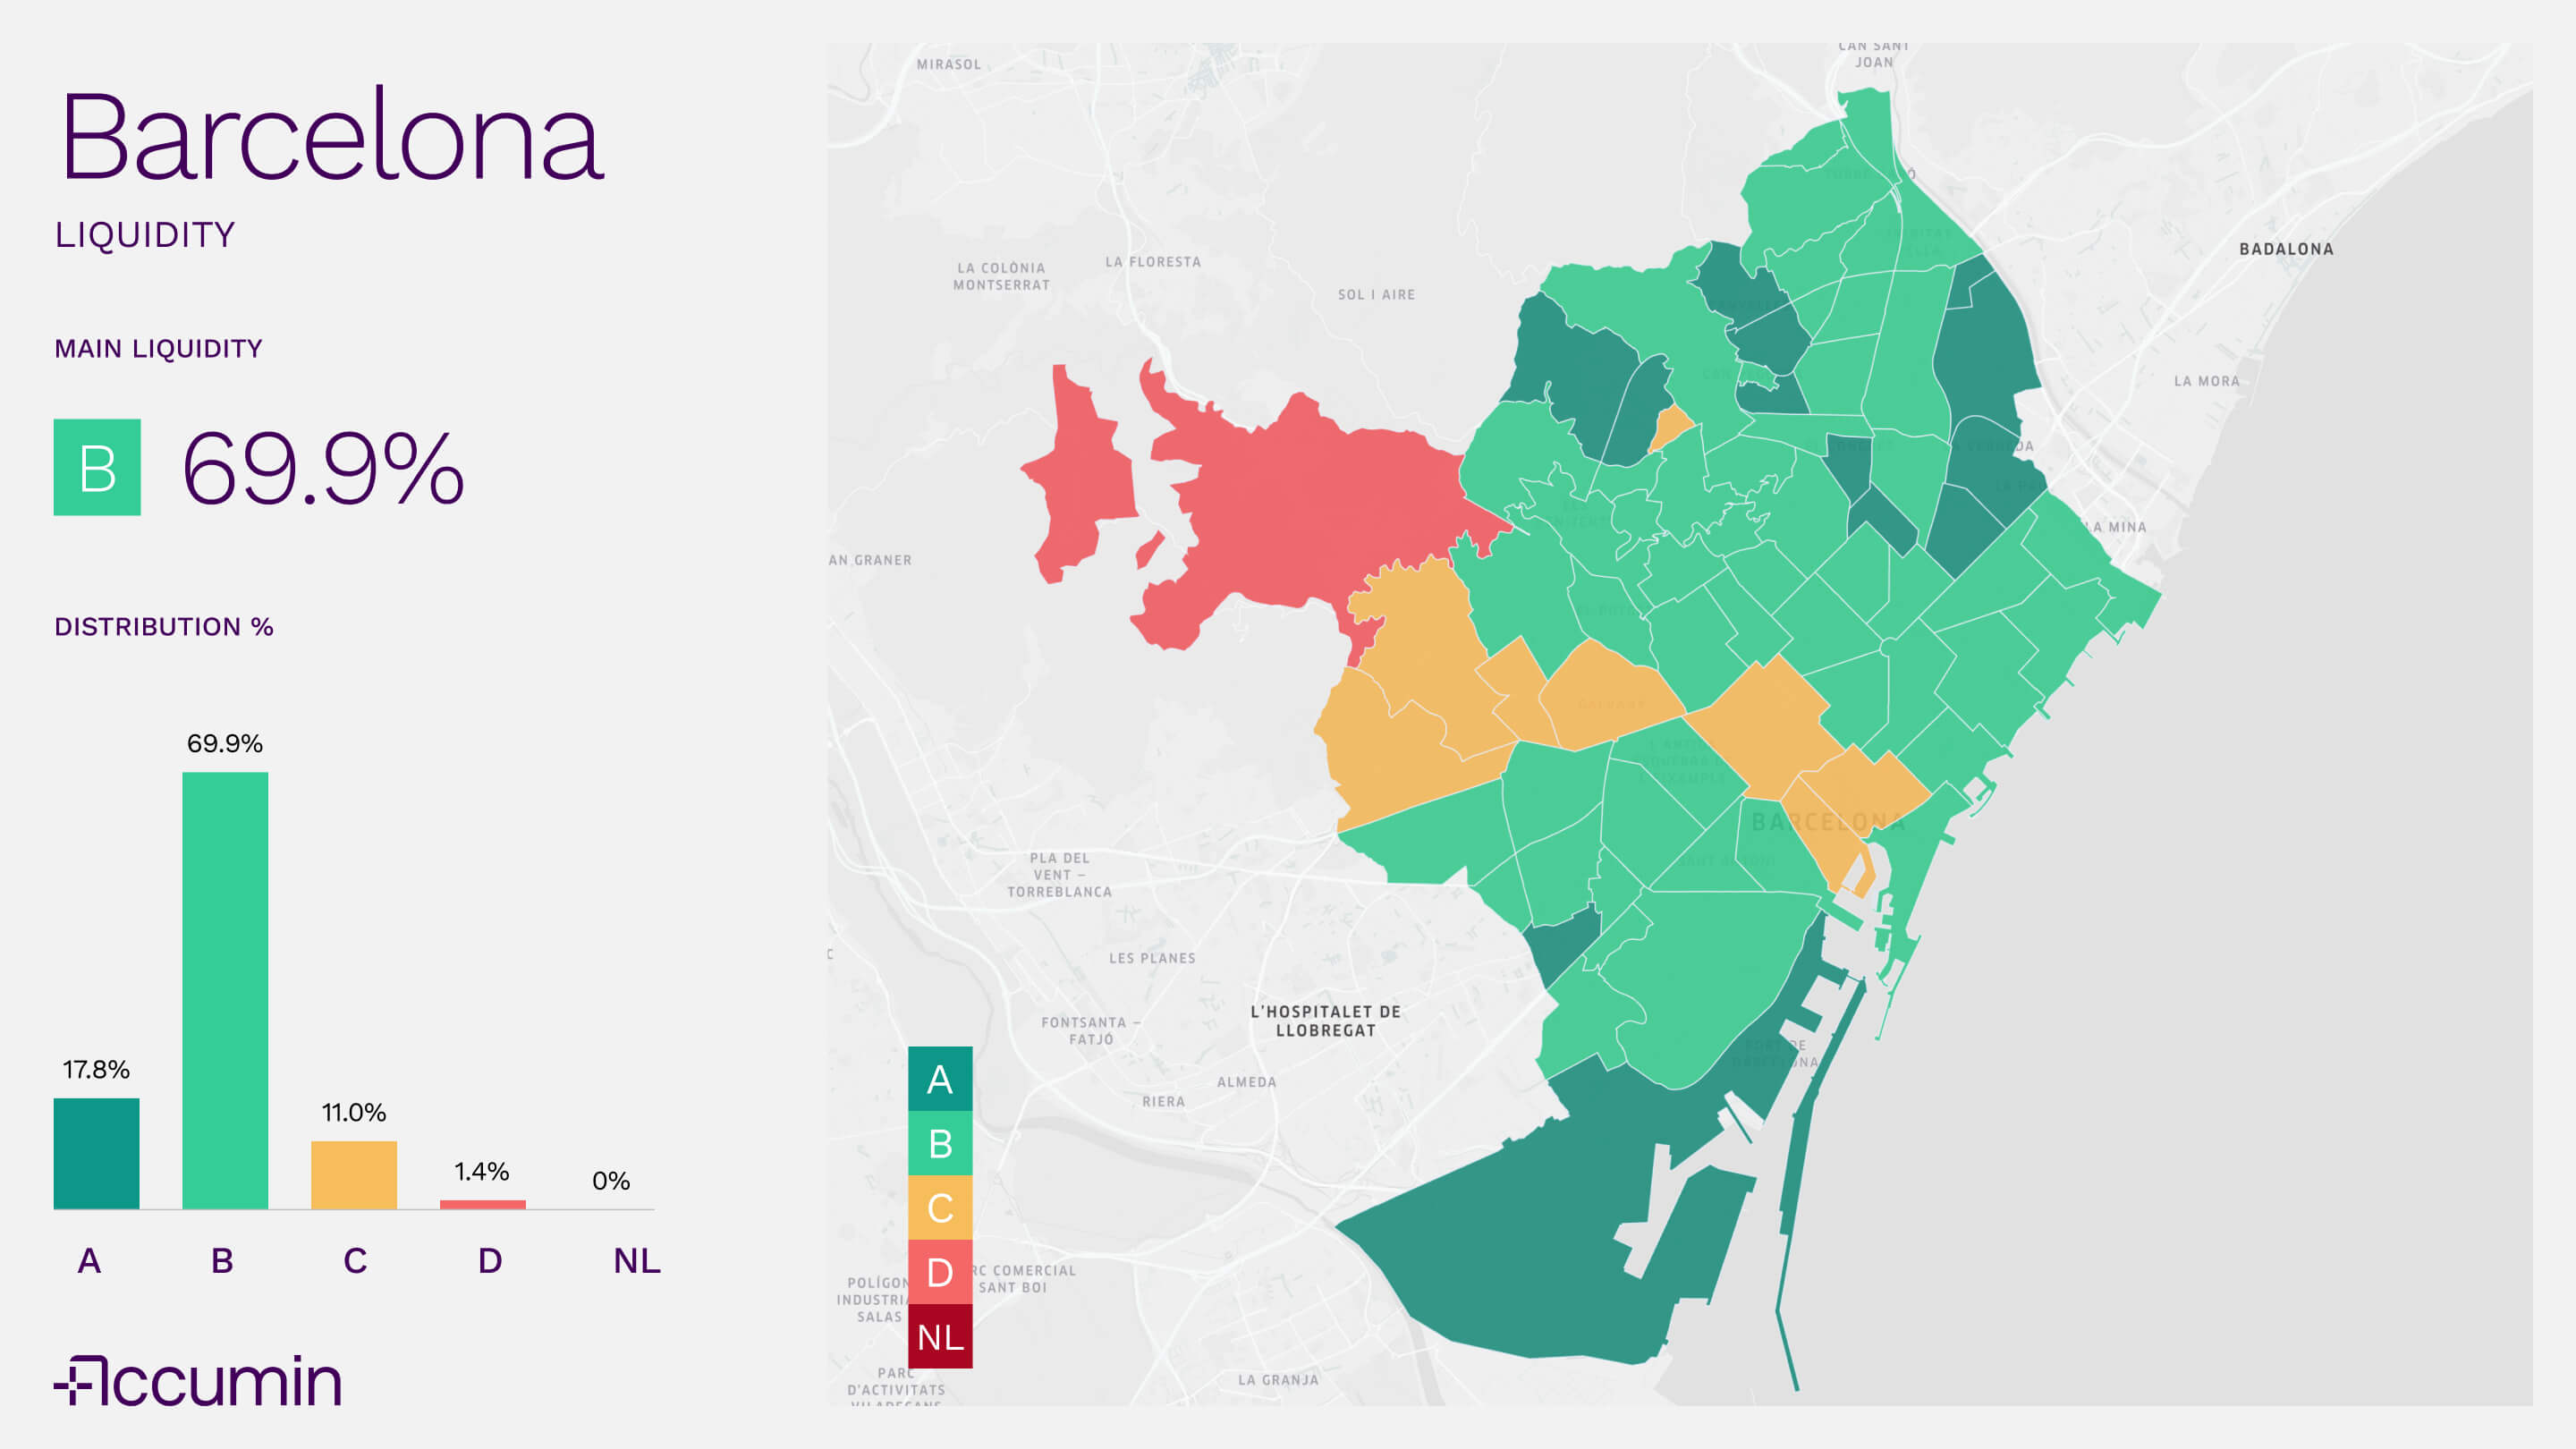
Barcelona has a market where medium-high liquidity predominates, although with marked differences between areas. 69.9% of the residential stock is in level B, indicating agile marketing in most of the city.
At the top end of the scale, 17.8% of the stock reaches level A, with particularly liquid neighbourhoods spread across different neighbourhoods in the north and south of the city.
The rest of the housing stock is divided between levels C (11%) and D (1.4%), with the least liquid assets concentrated mainly in Sarrià-Sant Gervasi, Eixample and Ciutat Vella, where sales are slower and homes tend to remain on the market for longer. At city level, there is no residential housing stock at level NL.
Liquidity is concentrated in medium-sized homes
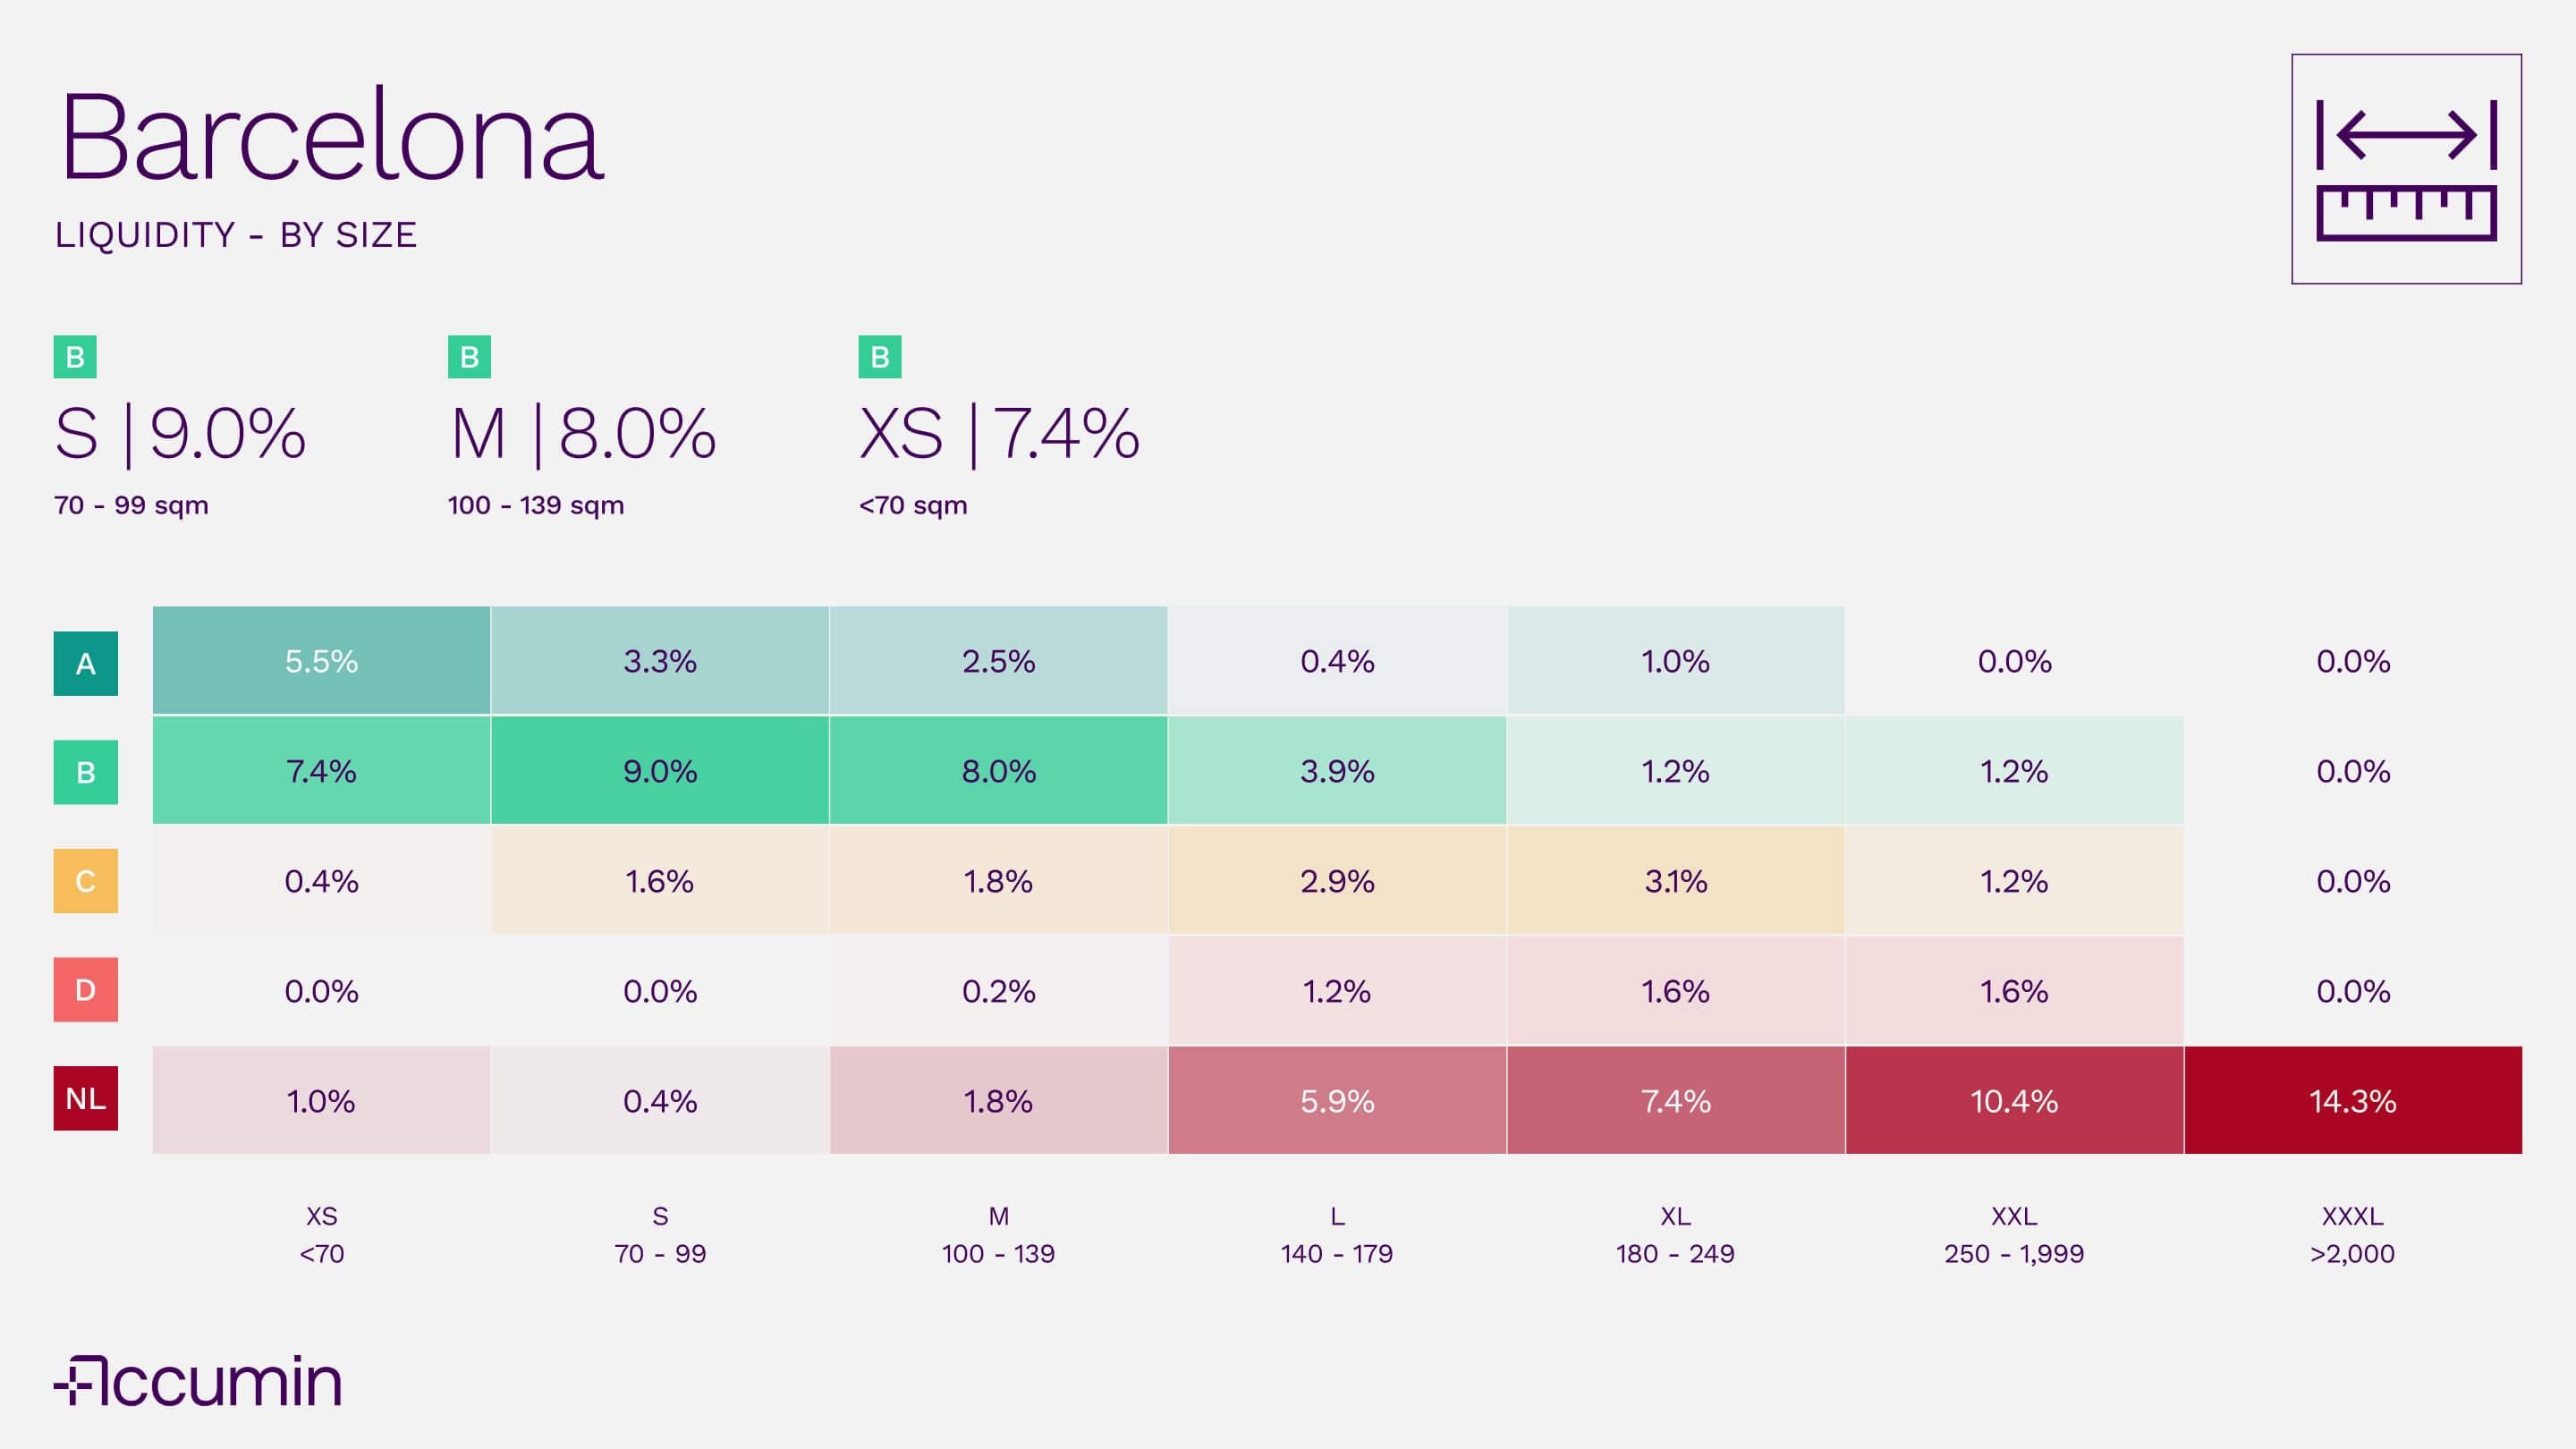
The size of the home is another decisive factor in its performance within the market. The graph produced by Accumin Intelligence shows that liquidity is quite polarised in the city's total housing stock.
The segments with the greatest presence and best performance are the most common:
- 7.4% of the stock is represented by XS homes (less than 70 m²) with B liquidity
- 9% of the total is made up of S homes (70–99 m²), also at level B
- M homes (100–139 m²), also at level B, account for 8%
Together, these three categories —up to 139 m²— make up a significant part of the market and show consistent levels of liquidity. These homes meet both the demand of individuals and the interest of investors, which explains their agility in the market.
Above this threshold, the trend changes. The larger segments show lower turnover. L homes (140–179 m²) and above tend to move towards level NL. In particular, 10.4% of the housing stock consists of XXL homes (between 250 and 1,999 m²), which are mainly at the NL level, as are XXXL homes (over 2,000 m²), which also show zero turnover (14.3%).
Type also sets the pace of the market
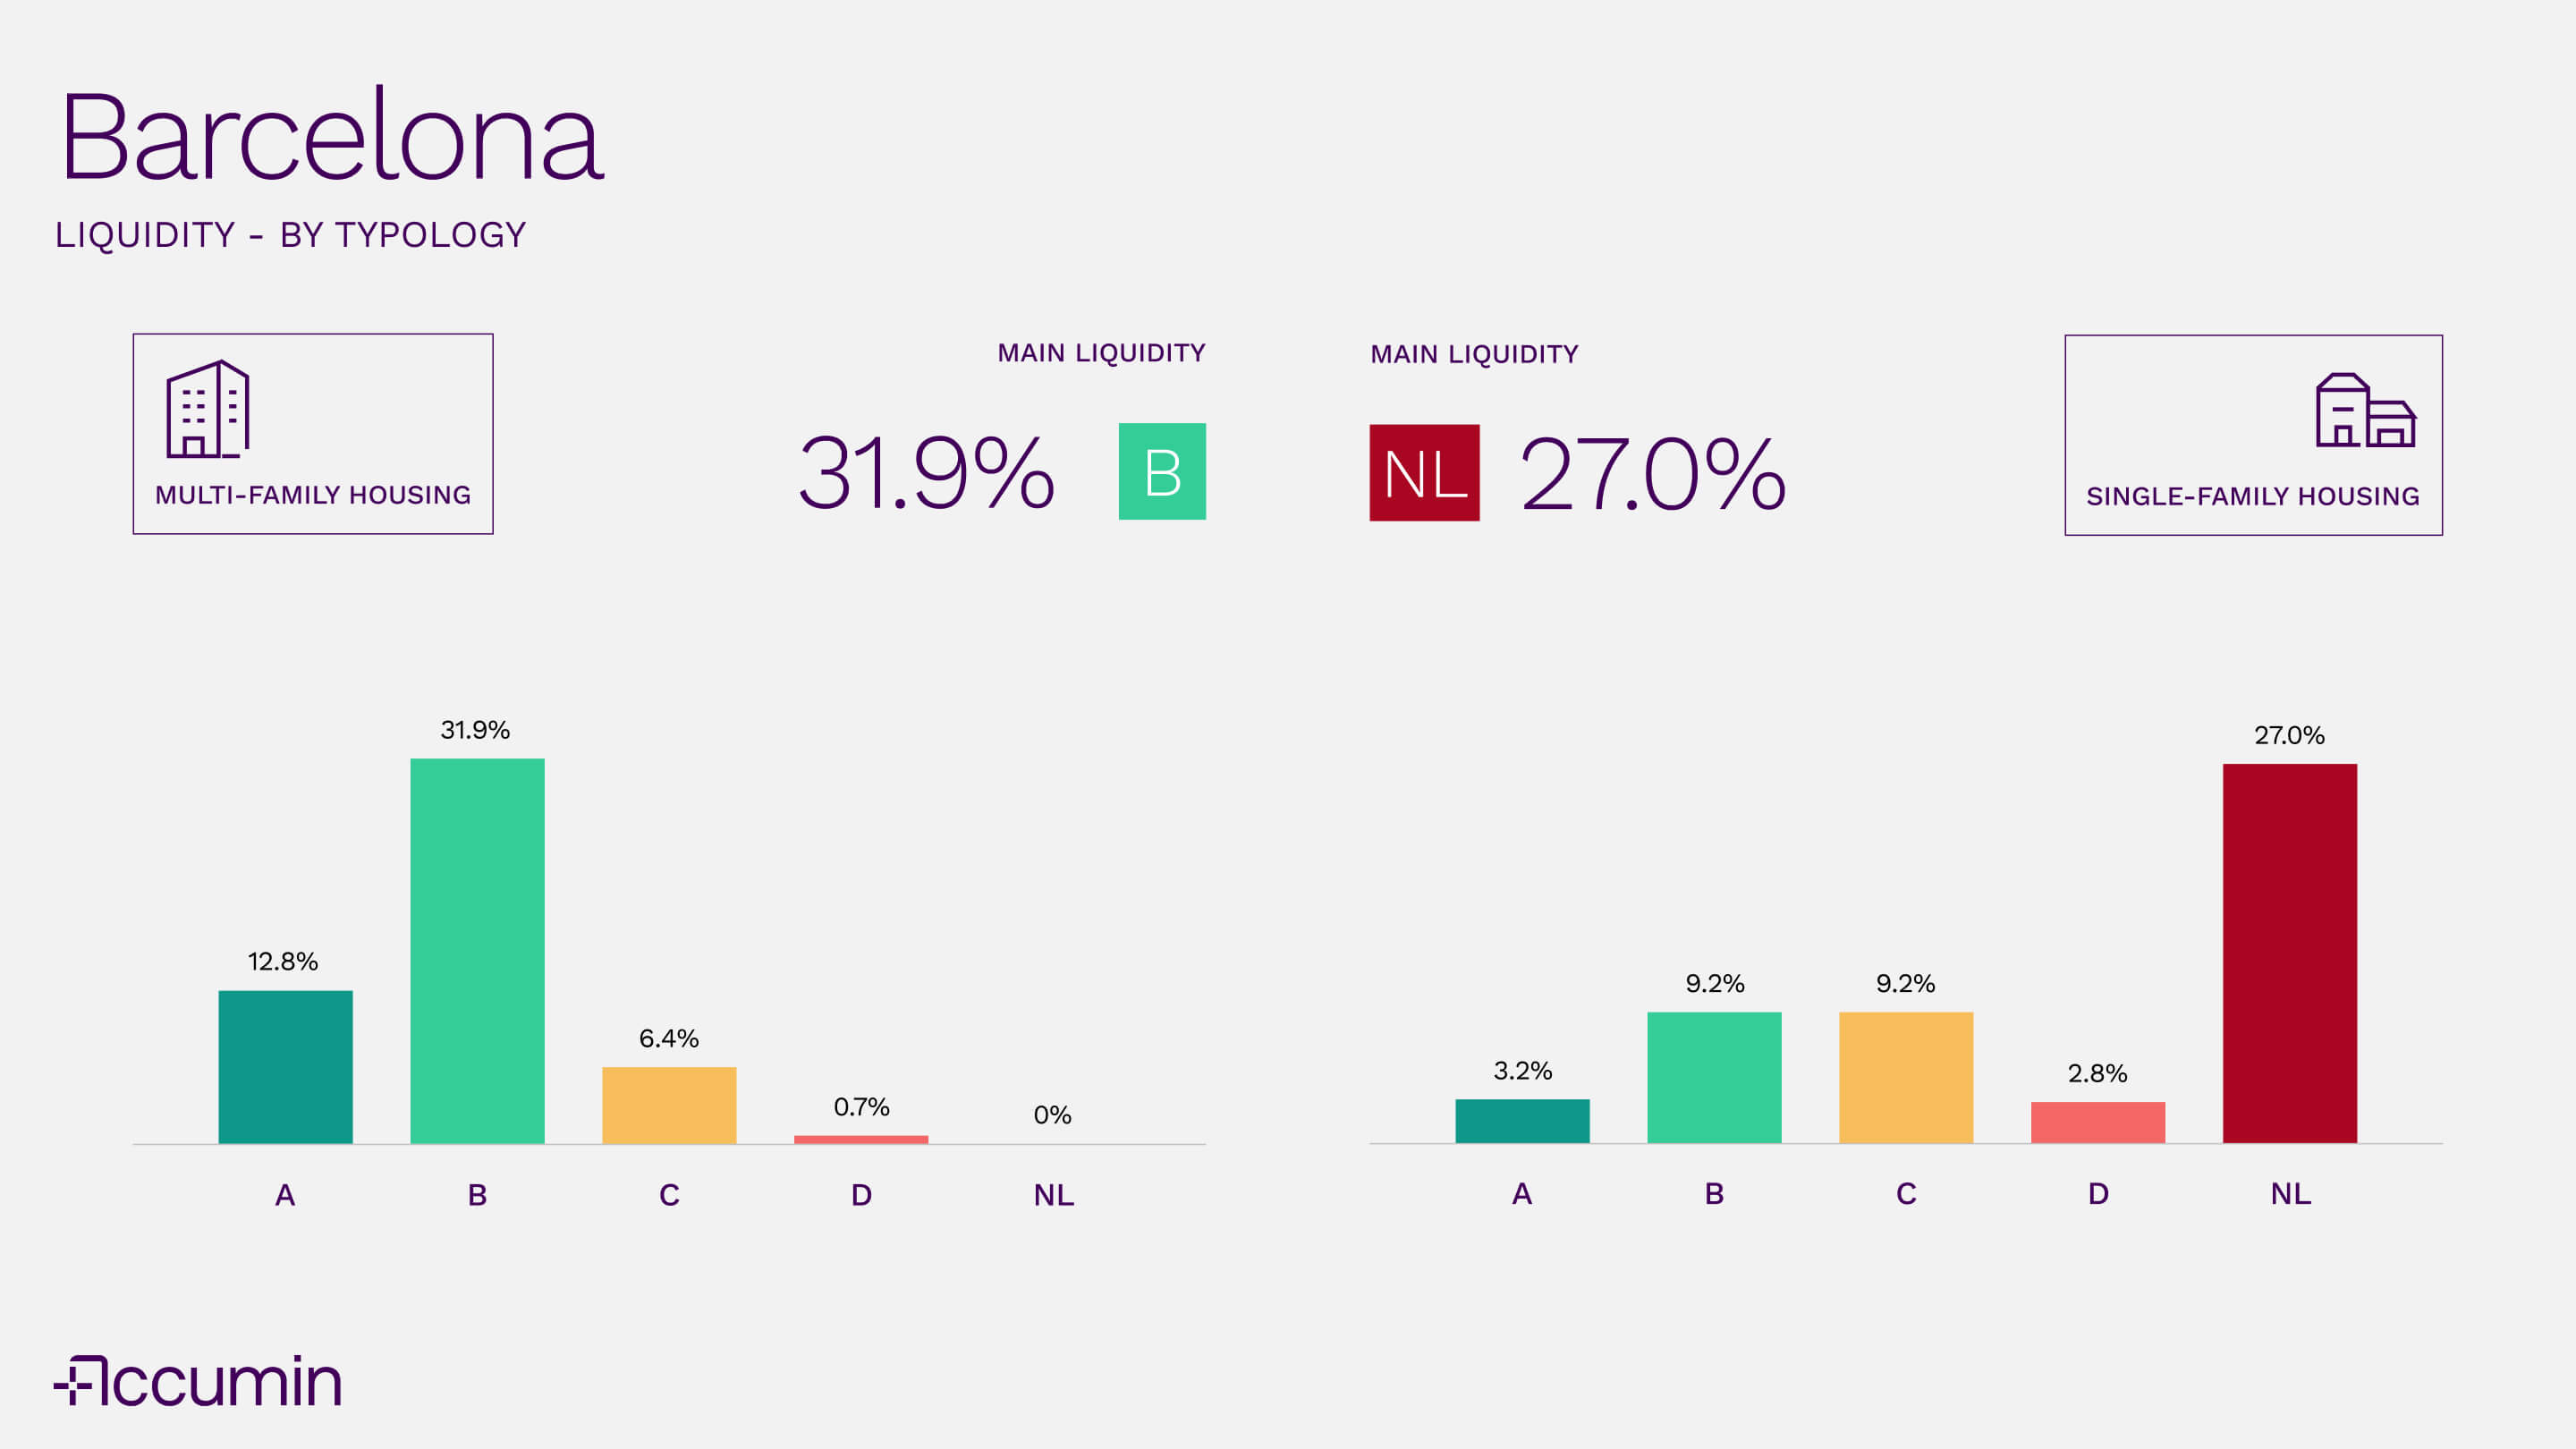
The difference between single-family and multi-family homes also clearly affects their liquidity. In the case of multi-family homes, the data shows dynamic behaviour:
- 31.9% of the total housing stock are flats at level B
- 12.8% are at level A
- Categories C and D have a residual presence, and no homes are detected at level NL
In contrast, single-family housing shows a much more static profile:
- 27% of the total stock are single-family homes at level NL, with no recent turnover
- 9.2% are at level B
- 9.2% more are at level C
- Level A barely reaches 3.2% in this type
These figures reflect how the Barcelona market is largely driven by the performance of flats. Houses, although attractive in certain niches, do not currently have the same mobility.
Beyond prices or fashionable areas, what determines the ease of selling a property in Barcelona today is its ability to move within the market. The data clearly shows this: most of Barcelona's housing stock is at high levels of liquidity, especially in the case of medium-sized or compact multi-family flats.
However, not all the market behaves in the same way. Large, single-family homes or those in peripheral areas tend to be concentrated at low levels of liquidity or have no turnover at all. For those who need to sell, invest or set prices accurately, understanding these dynamics is essential.
Because knowing the value of a property is important, yes. But knowing how long it will take to sell can make all the difference.

Virginia Pérez