Real estate investment opportunities in Barcelona: Which neighborhoods lead in sales and rentals
Every day, new real estate investment opportunities appear in Barcelona, both for rent and for sale. Seeing them on a map, neighborhood by neighborhood, completely changes the way you read the market. It's not just about knowing where there is the most activity but also understanding what that pace means for investors: where turnover is fast, where inventory is stagnant, and how the two speeds that coexist in the city are drawn.
In this analysis, we review what the daily activity maps tell us and what signals they offer about the liquidity and real behavior of each area.
Rental market: high activity concentrated in a few neighborhoods
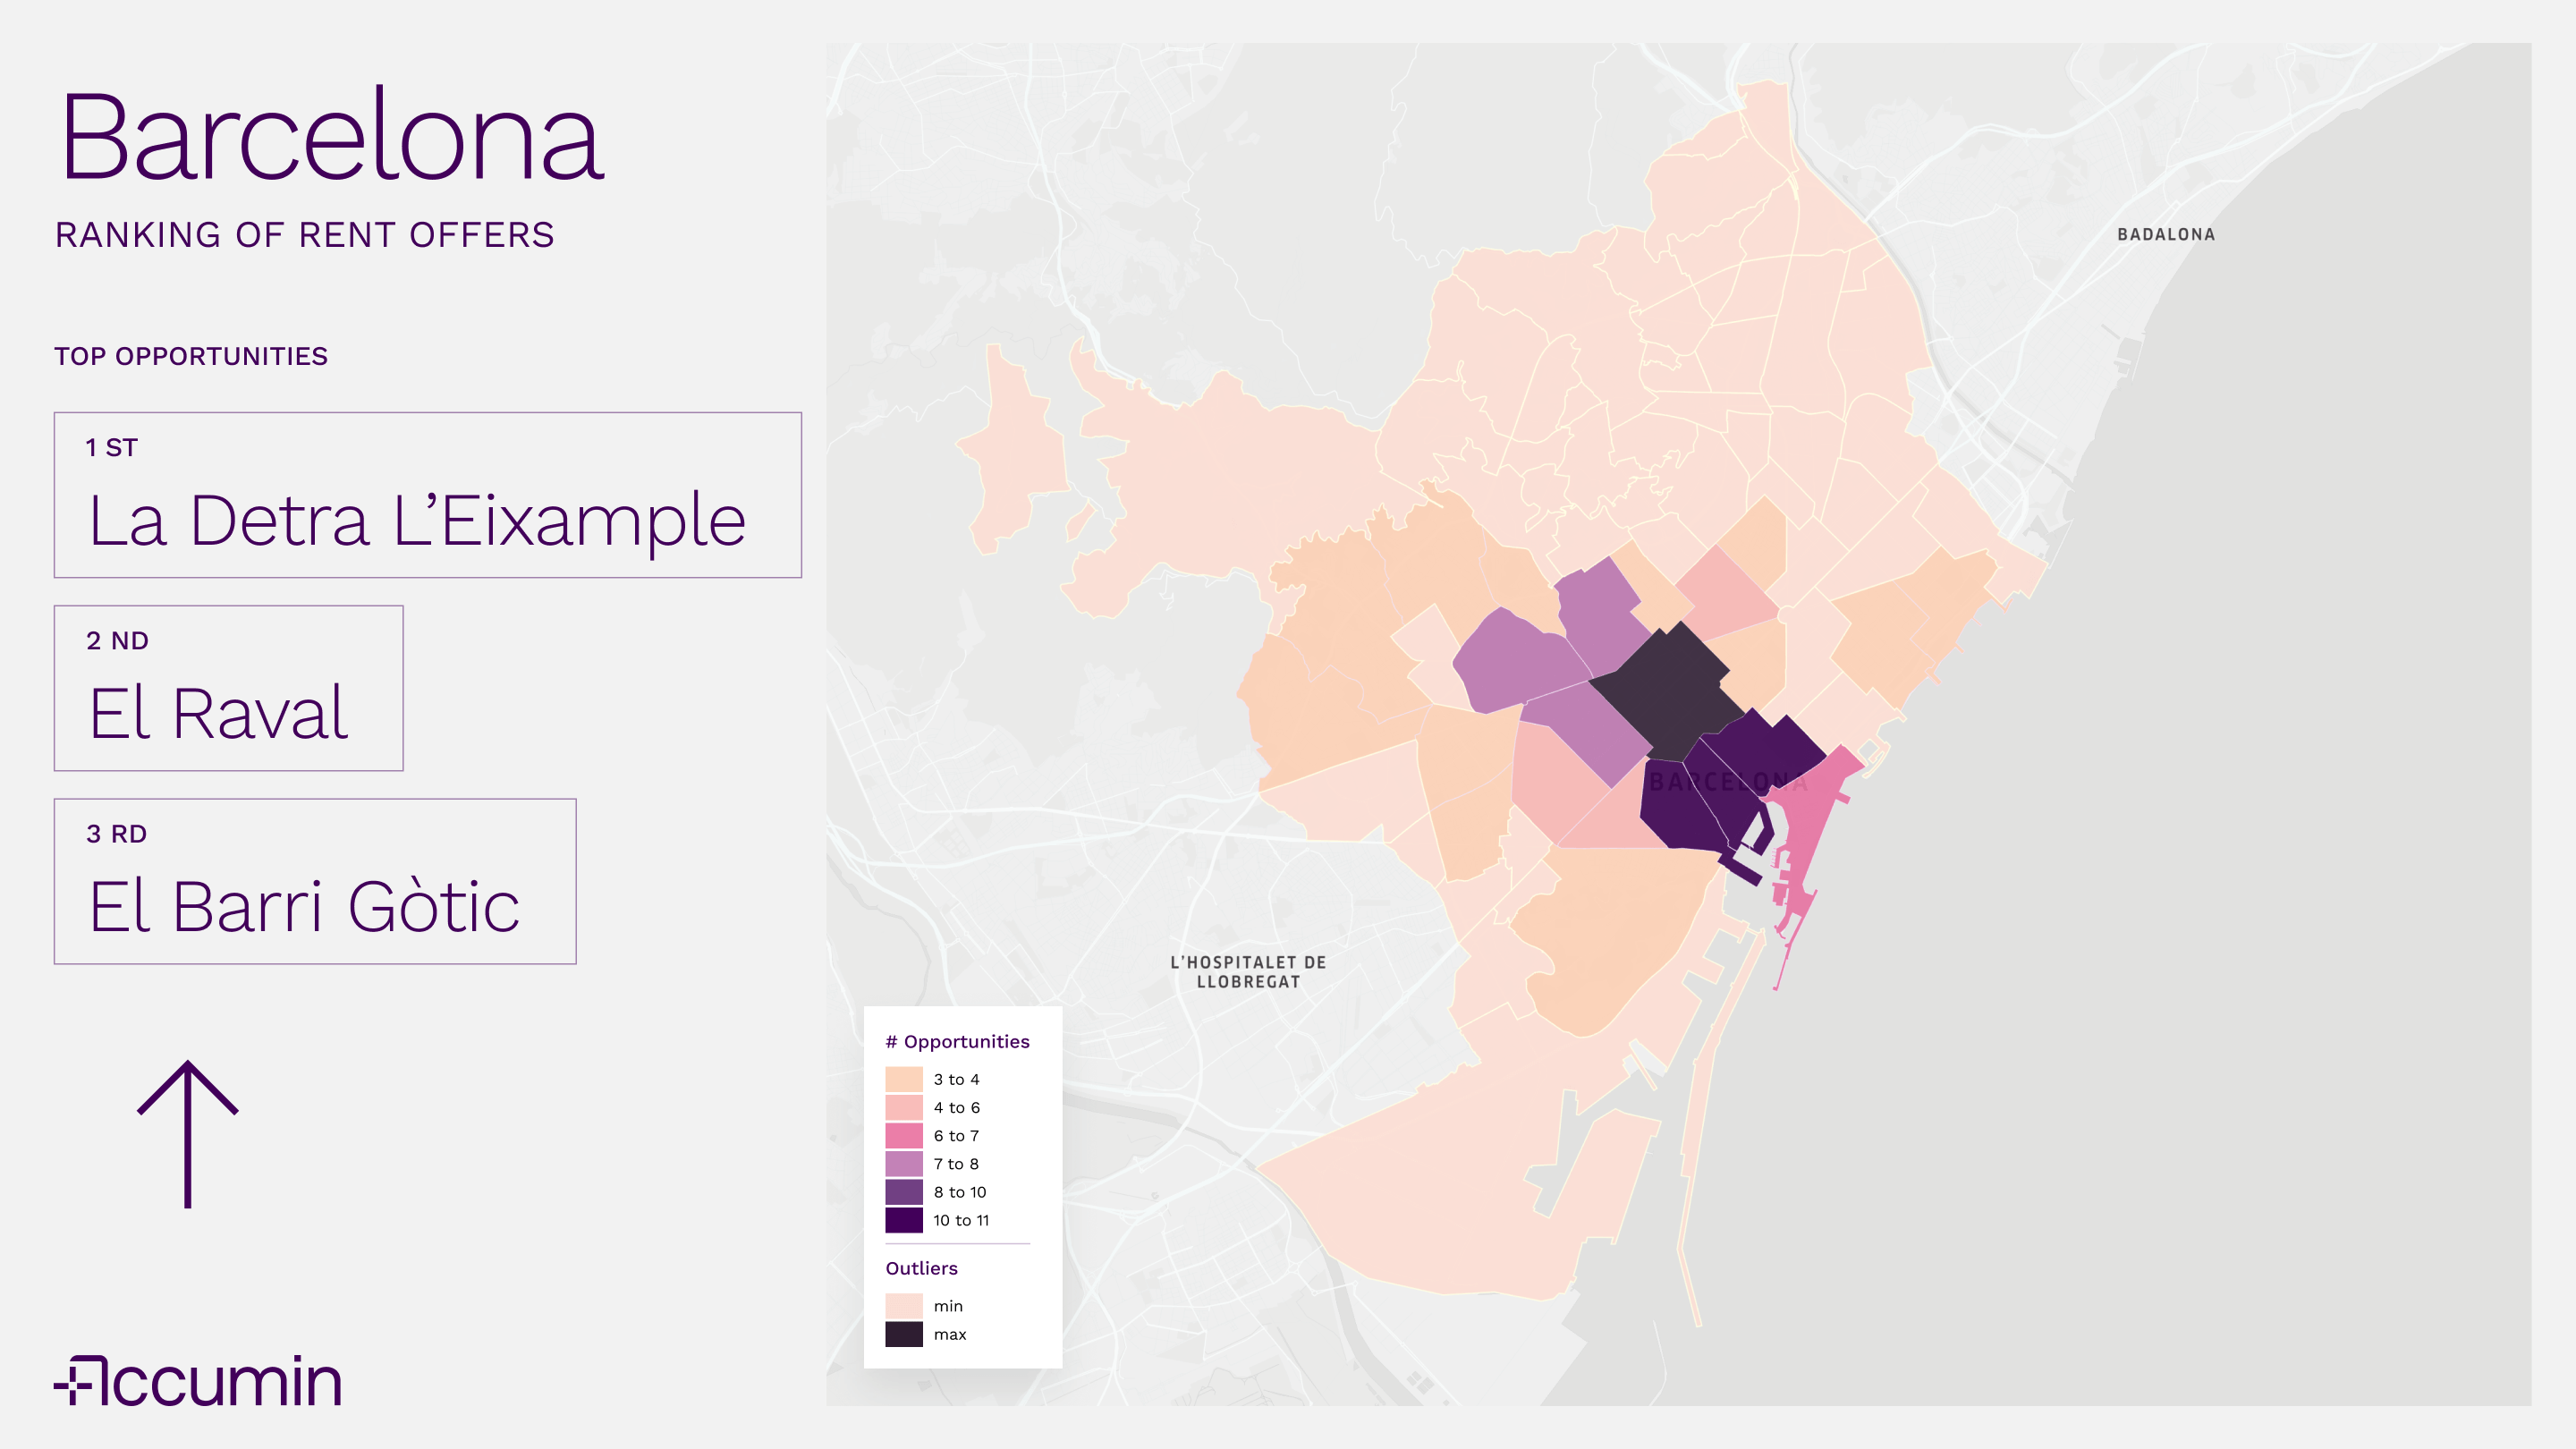
Neighborhoods with the highest intensity of new rental offers
The rental map shows a city with extremely uneven behavior. The purple tones, which indicate a high volume of new investment opportunities every 24 hours, appear in very few neighborhoods. Most of Barcelona is shown in different shades of yellow, reflecting a low and sustained pace, with hardly any new properties coming onto the market each day.
Within this context, the contrast is clear. La Dreta de l'Eixample, El Raval, and el Barri Gòtic stand out as the most active neighborhoods in the ranking. Sant Pere, Santa Caterina, and La Ribera join them, forming a small cluster of high intensity. In addition, we can see three enclaves in intermediate purple tones. These are neighborhoods where there is daily movement and the supply is continuously renewed.
For investors, this concentration of activity is a valuable indicator because it reveals a market with rapid absorption. In other words, it is an environment where placing an asset is usually more agile and where demand keeps pace.
Areas with less movement and slow turnover
Outside this core, the city moves at a different pace. Soft yellow tones dominate almost the entire map, marking a dynamic in which new opportunities are few and far between. At the bottom of the ranking are Torre Baró, la Trinitat Vella, and la Font d'en Fargues, which have the lowest level of activity.
Here, the slower pace conditions expectations: supply takes longer to renew and each movement has greater weight. Investors depend more on the specific characteristics of the asset to ensure a good future return.
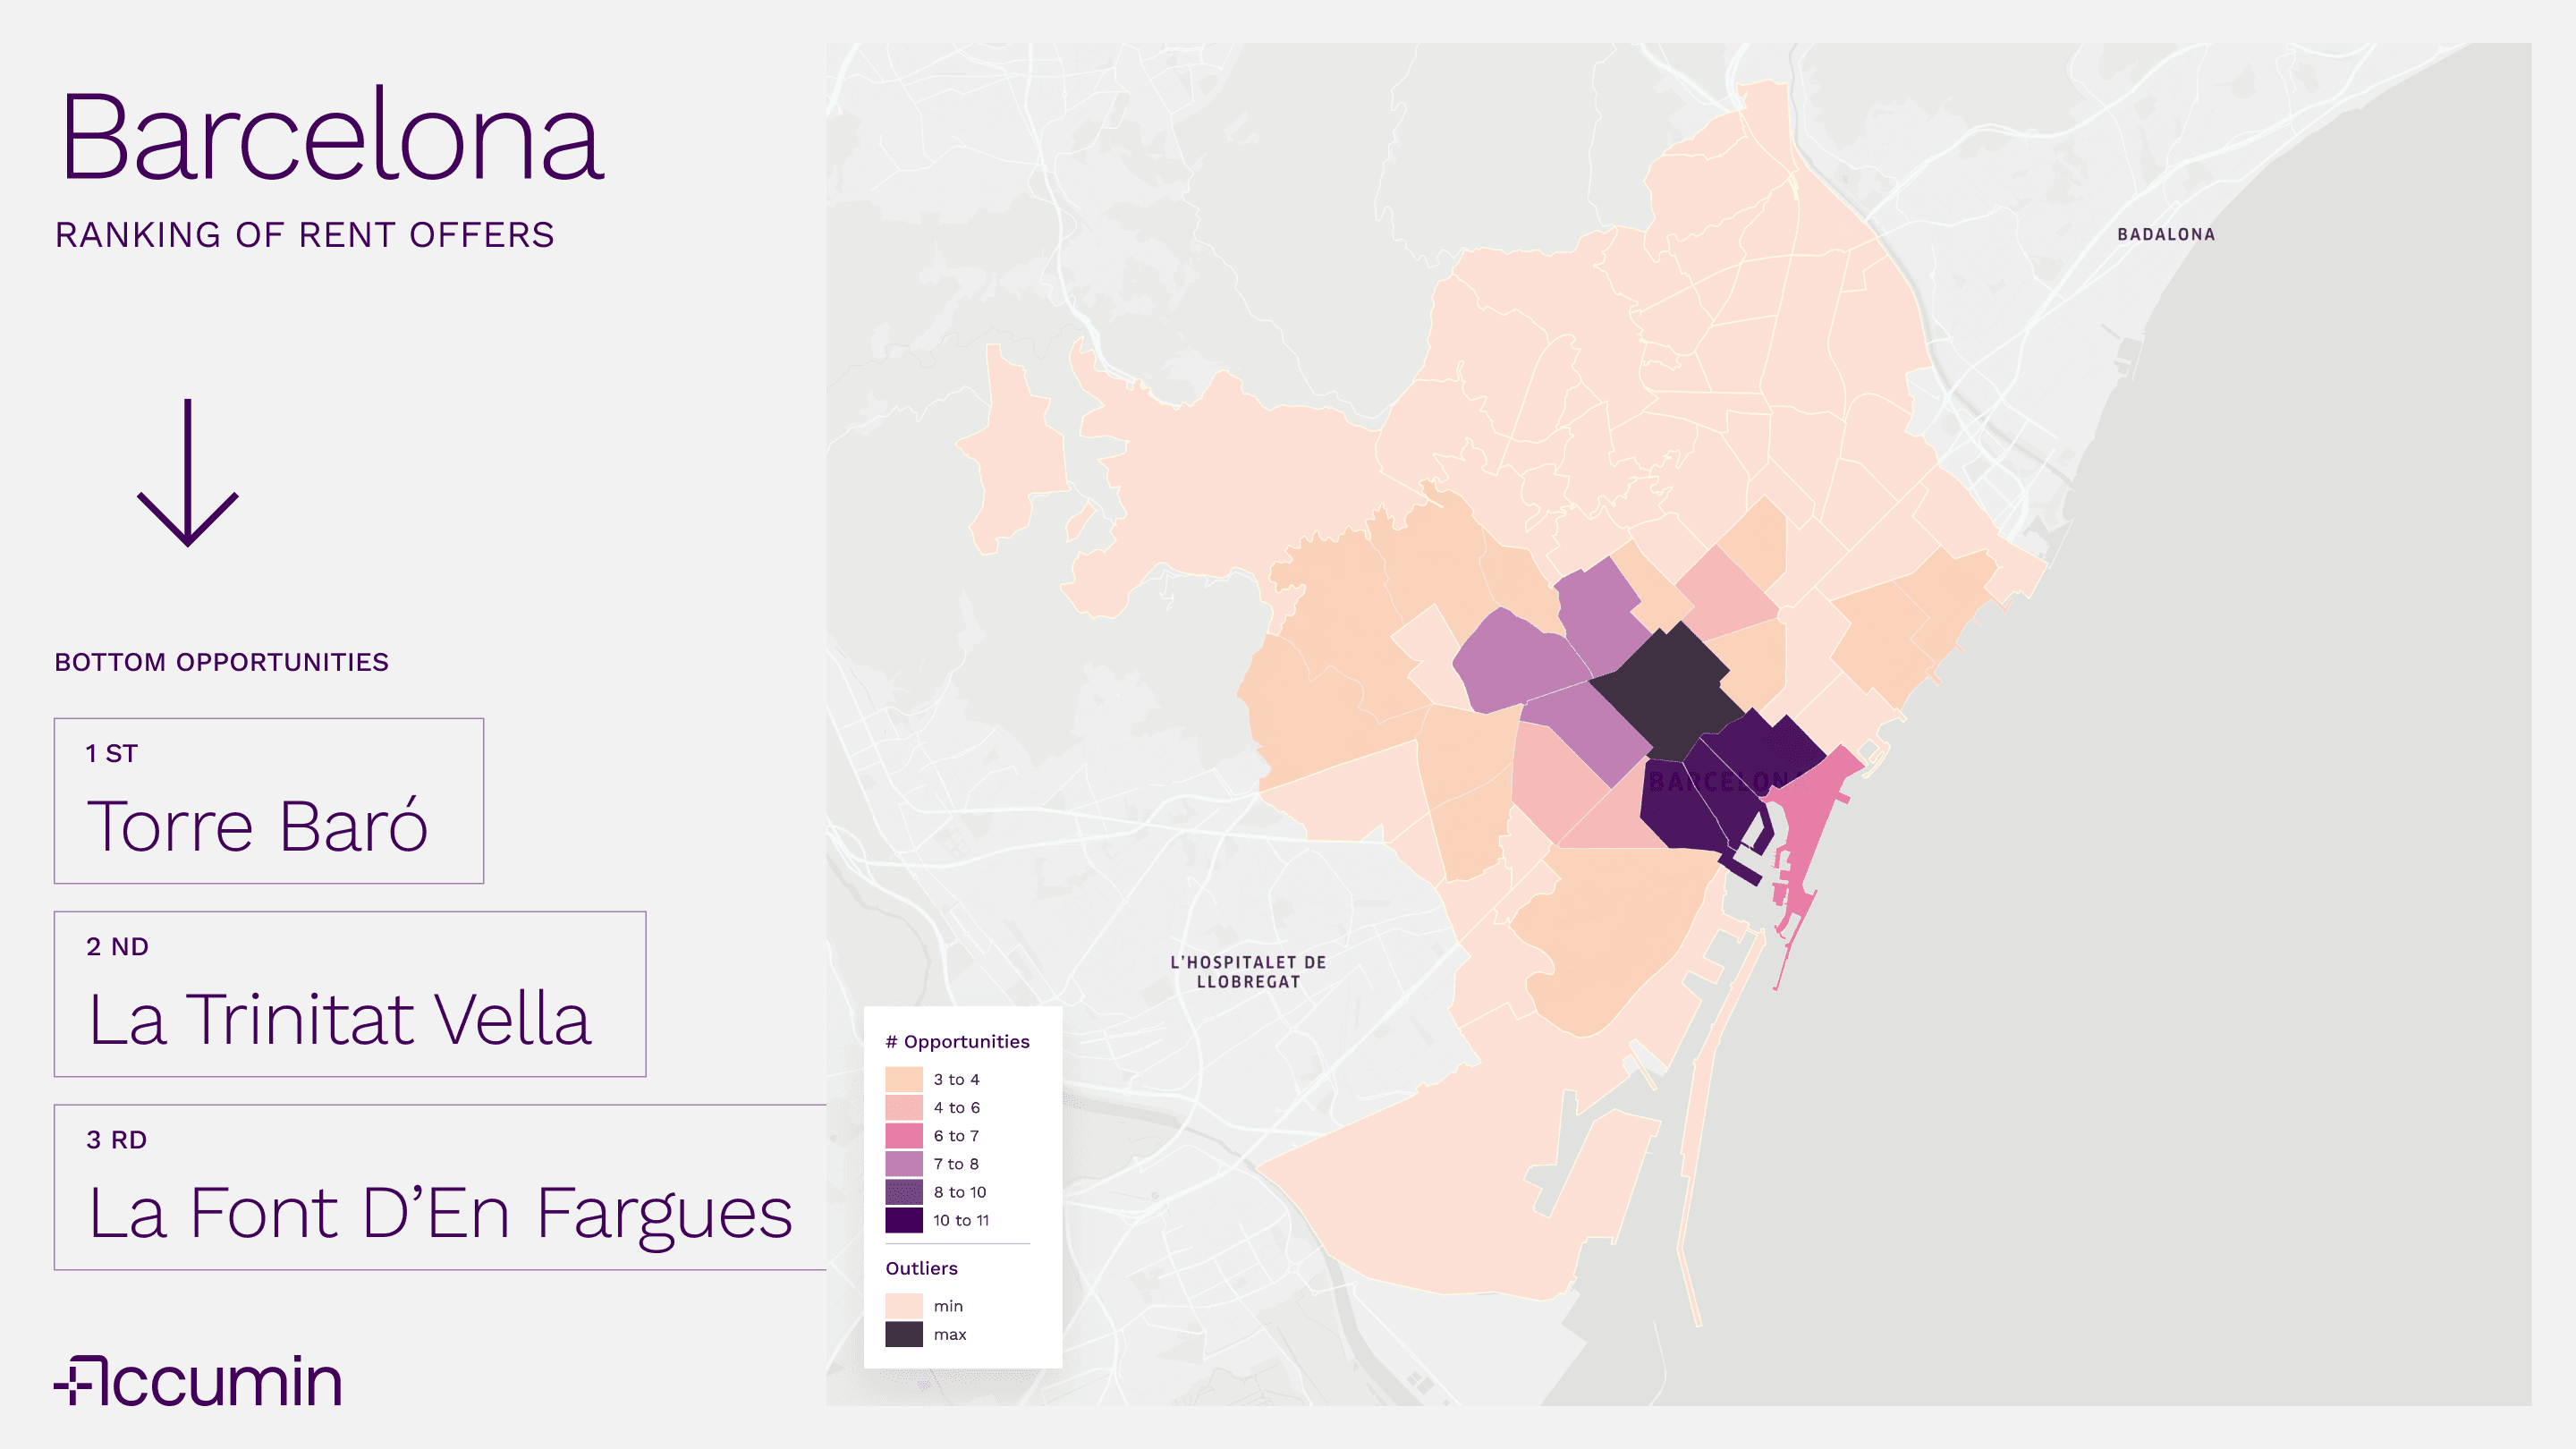
The result is a map that depicts a polarized Barcelona: a very dynamic center surrounded by a ring of neighborhoods where the market is advancing at a modest pace.
Sales market: more widespread dynamism spreading out from the center
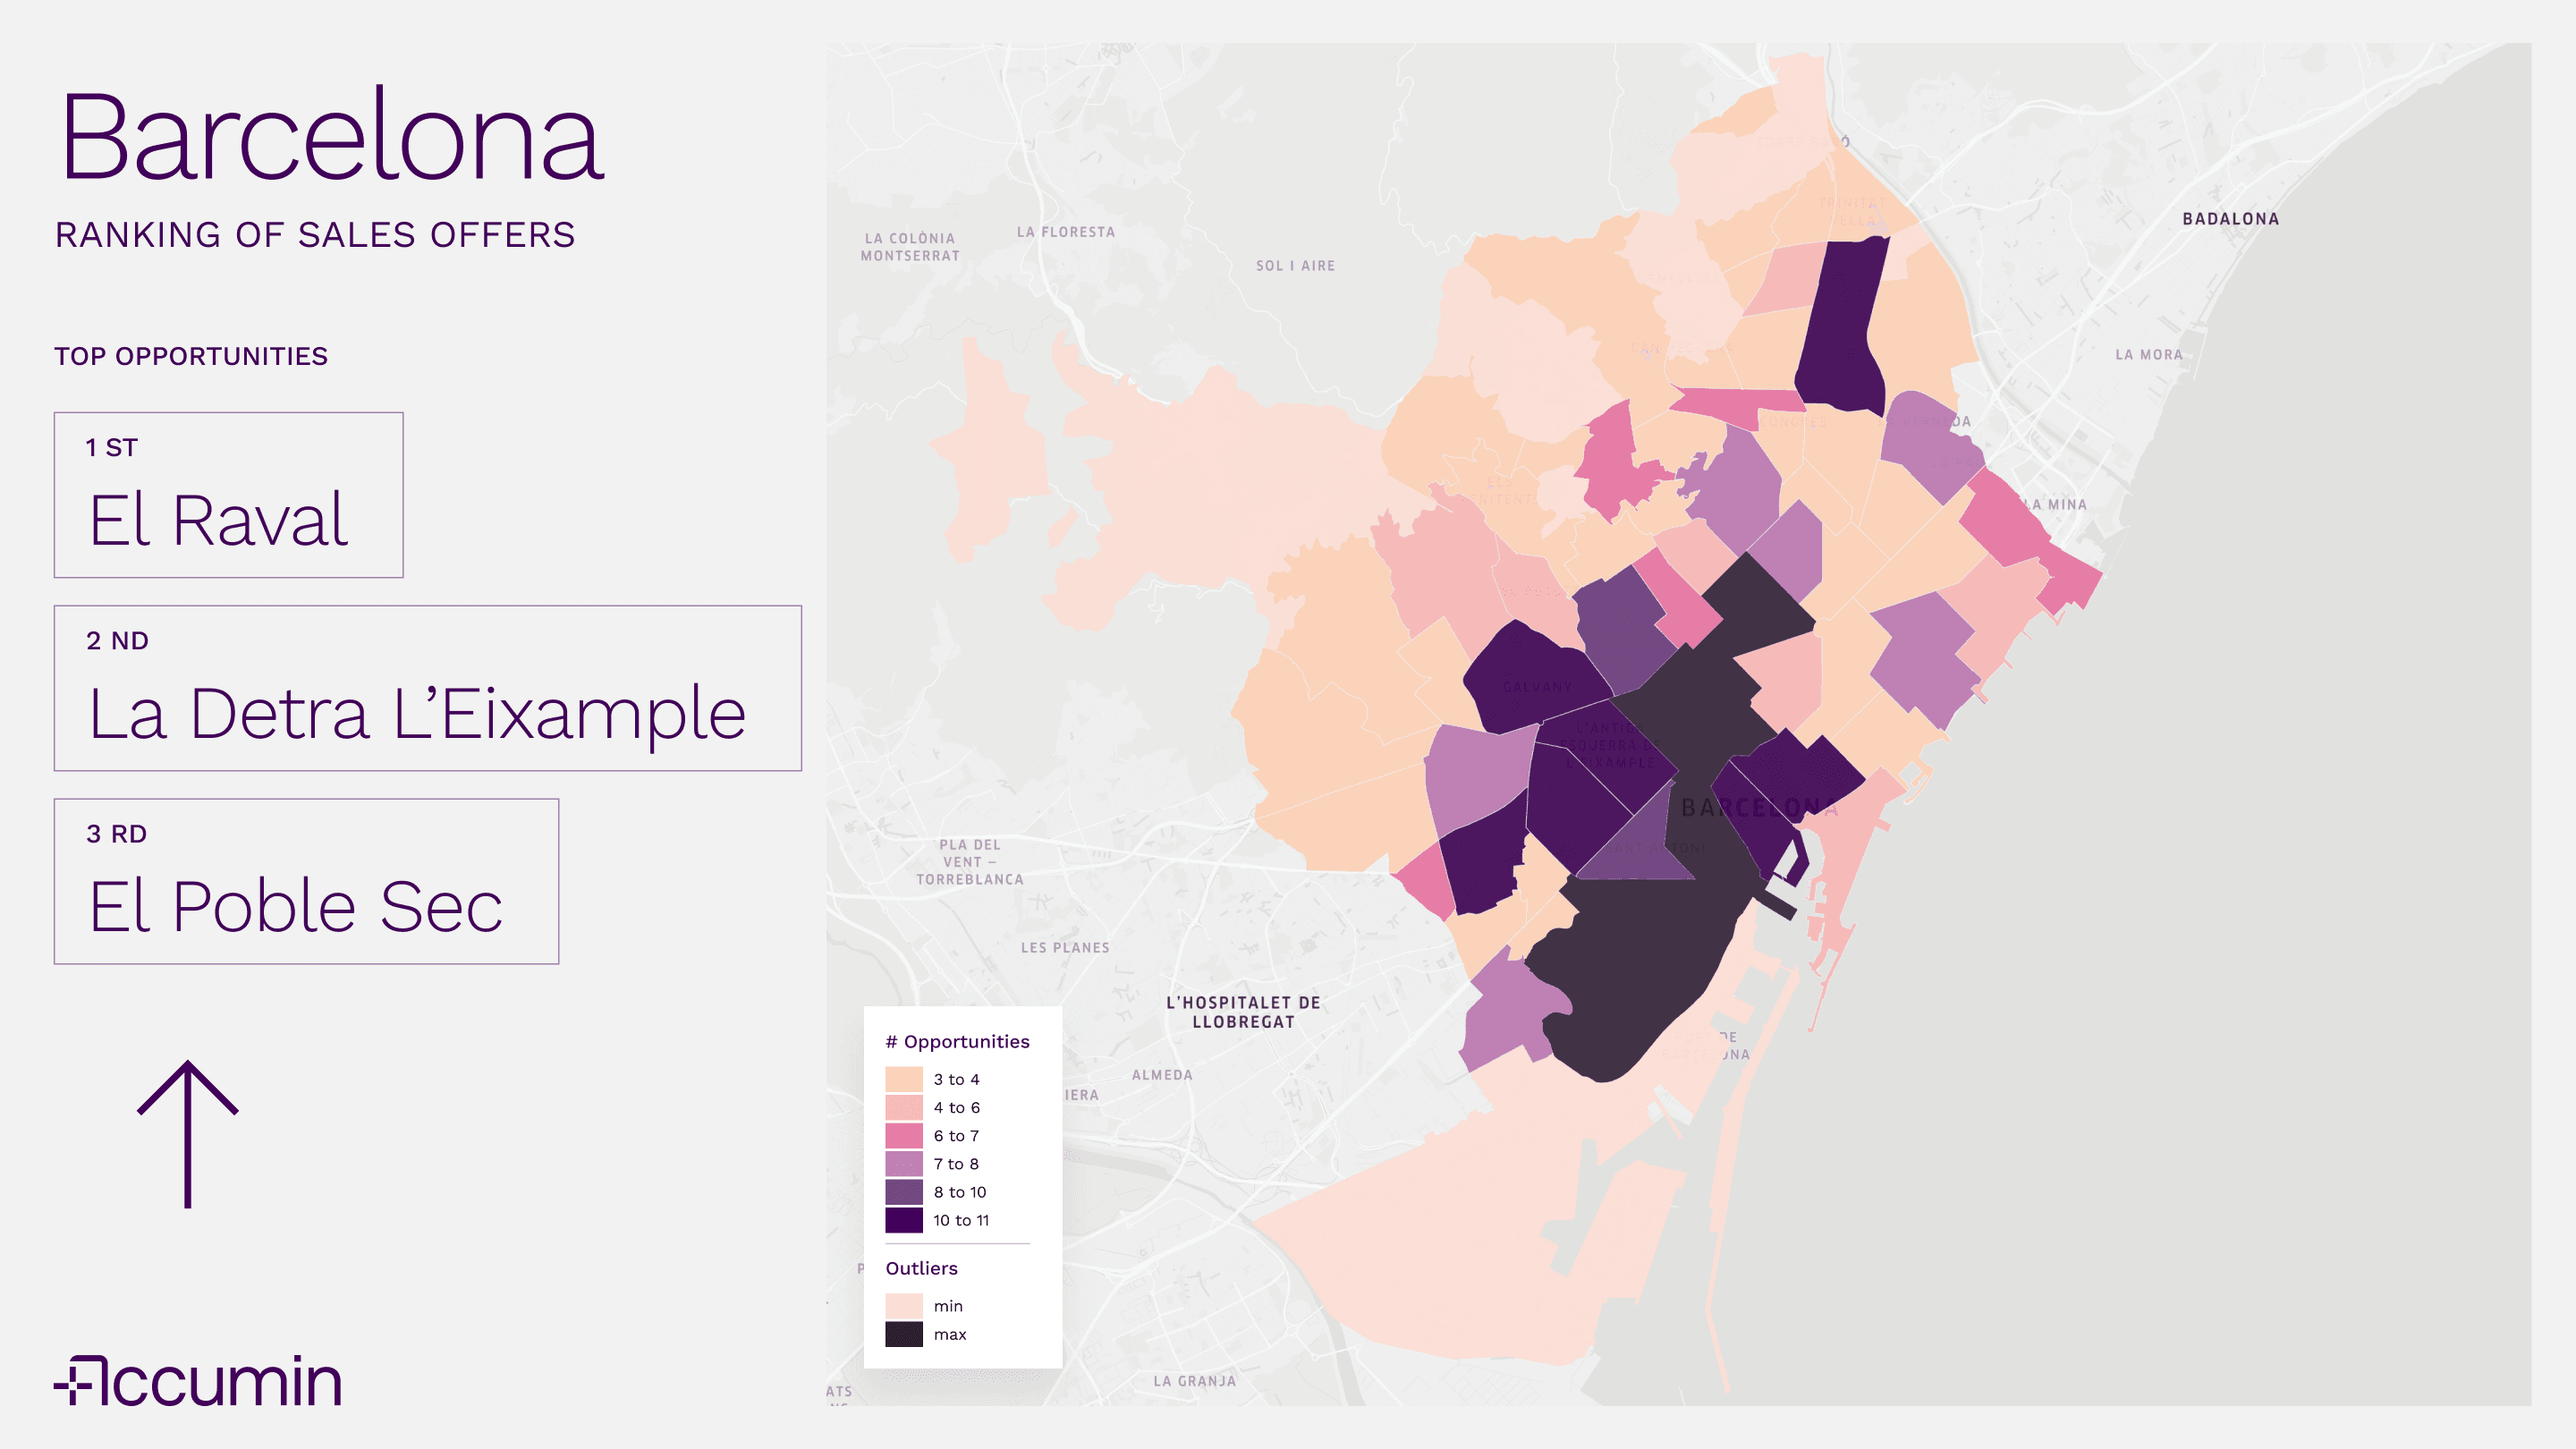
Neighborhoods with the most sales opportunities every 24 hours
In the sales market, the picture changes. Although the city center continues to account for a large part of the activity, it is spread over a wider area. El Raval tops the ranking, followed by la Dreta de l'Eixample and el Poble Sec. These are neighborhoods where the number of new opportunities per day is high and where inventory is constantly being renewed.
Interestingly, this intensity is not confined to the city center. Sagrada Familia and Sant Andreu de Palomar also show high levels of new opportunities, and they are joined by a larger group of neighborhoods located to the northeast, which form an active hub where sales are renewed with agility.
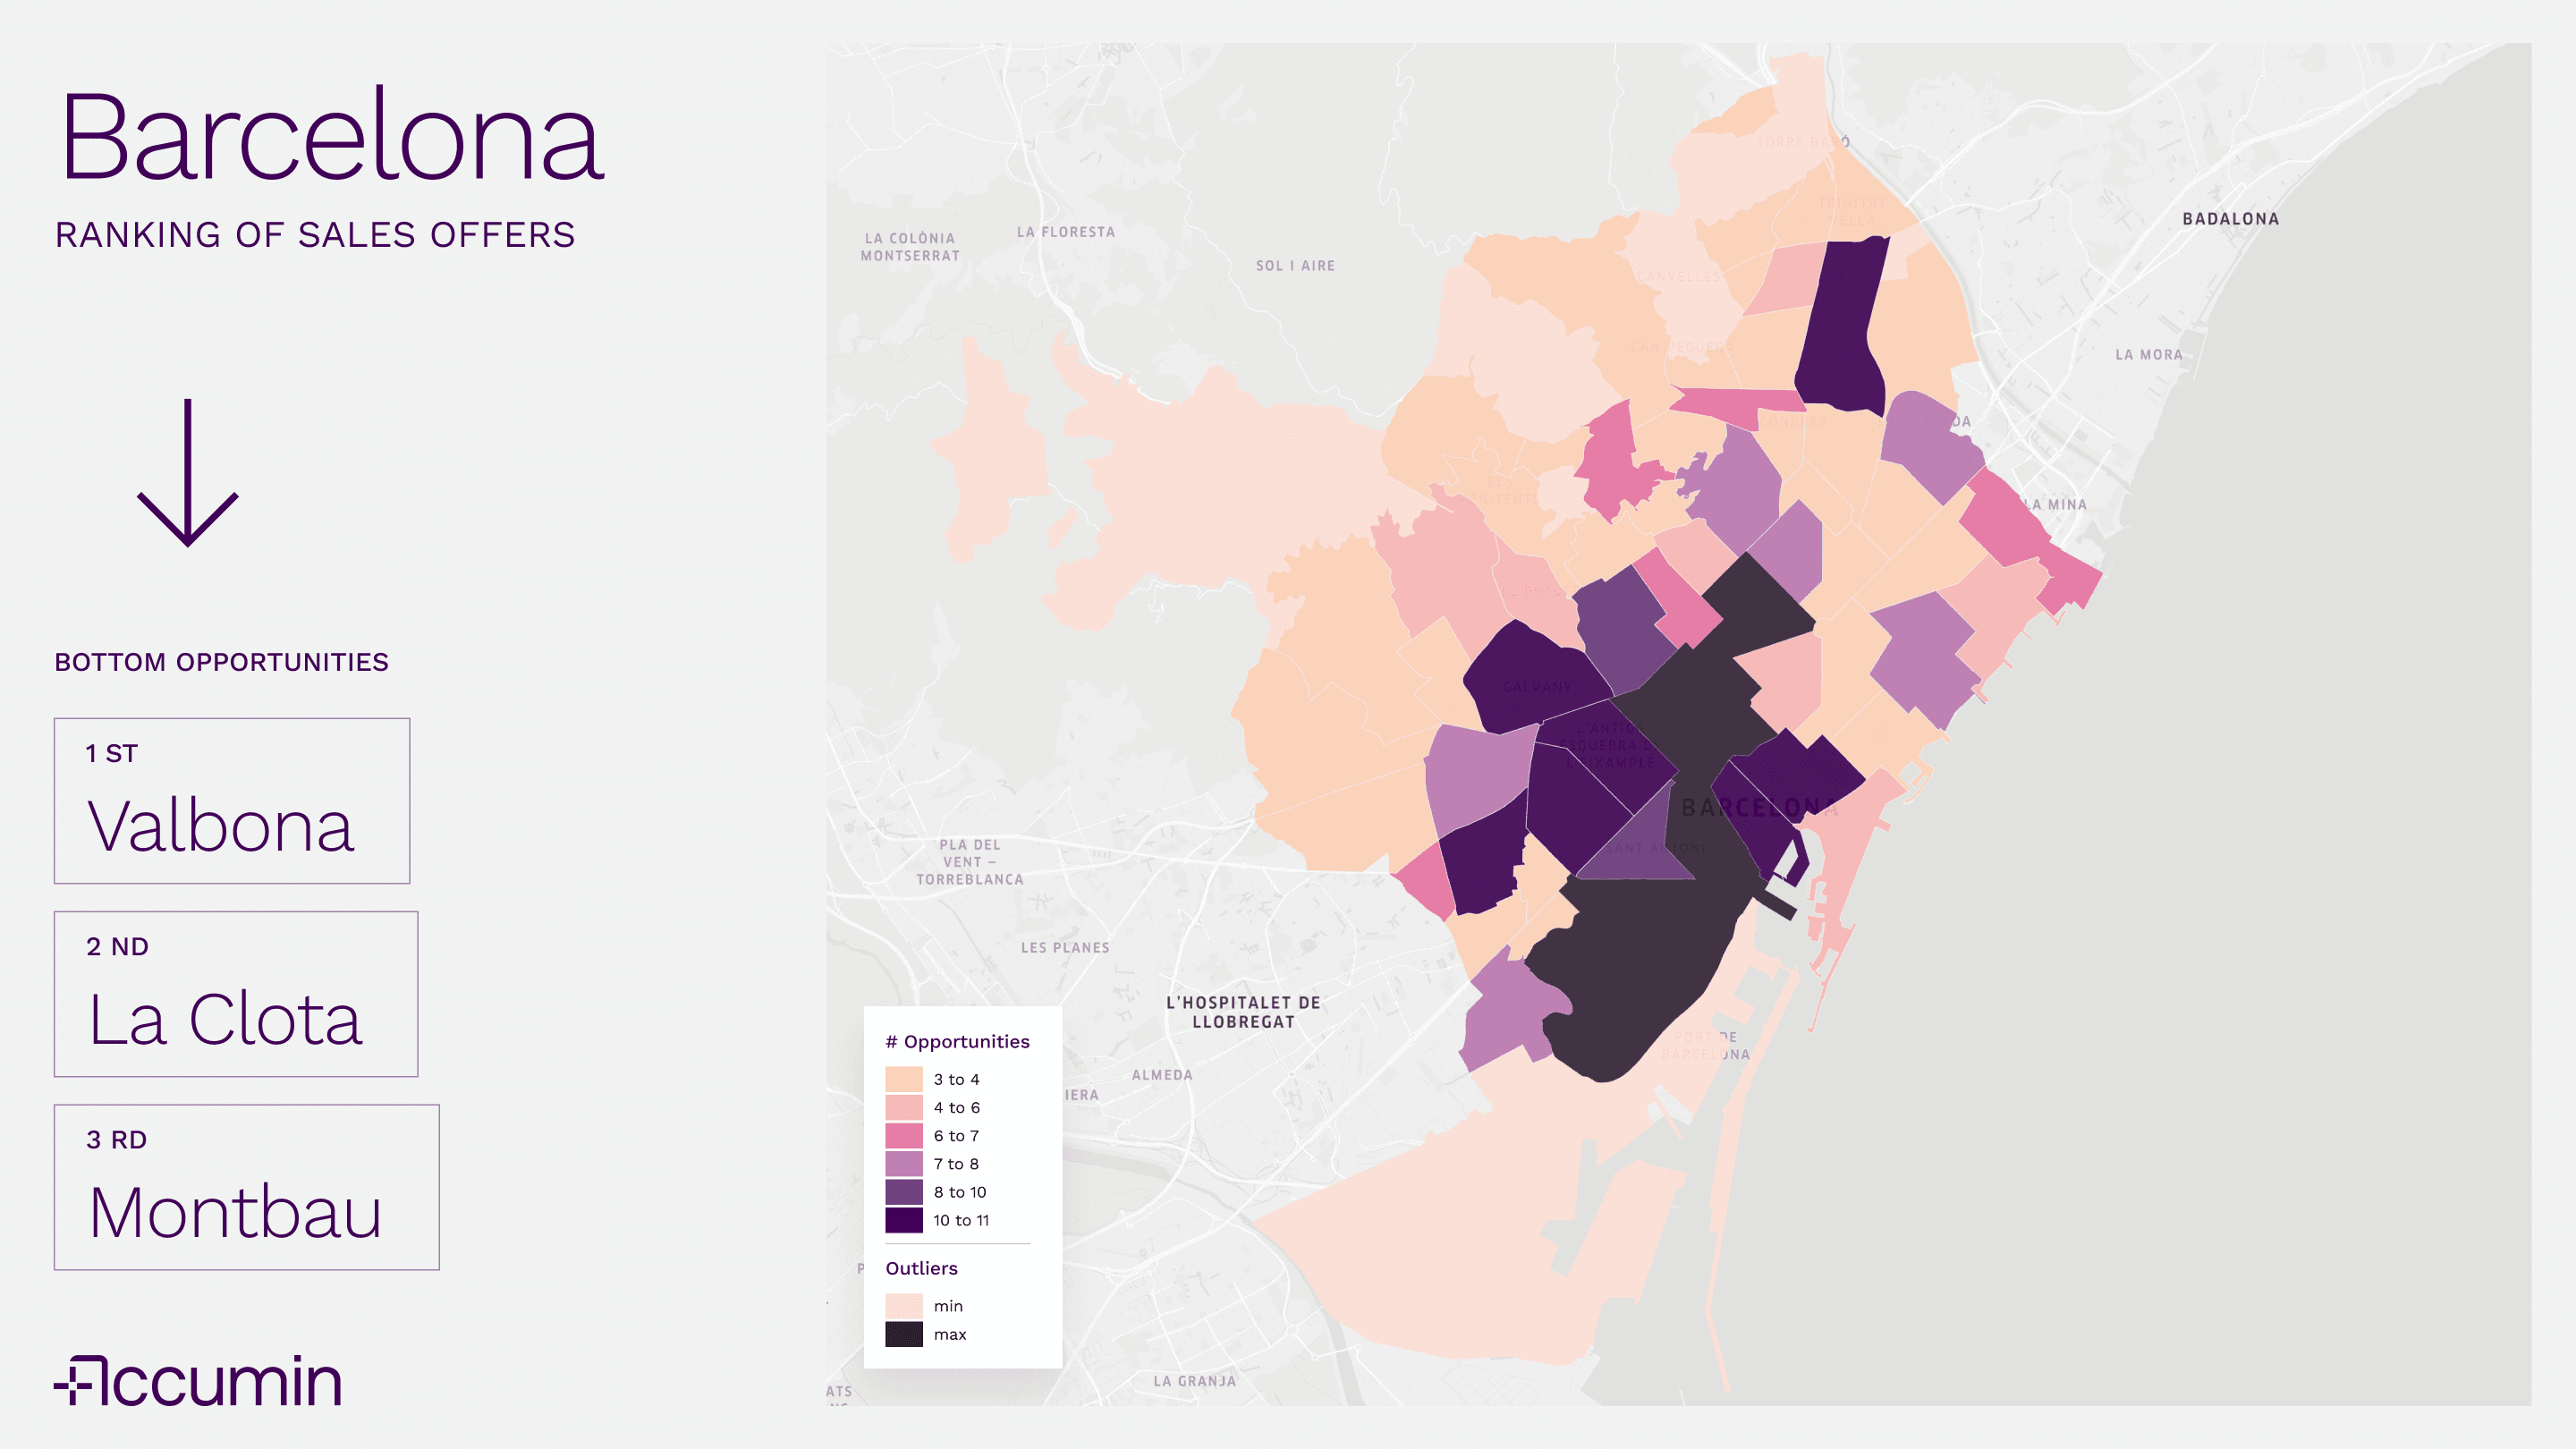
Neighborhoods with less dynamism in the sales market
At the opposite end of the map are Vallbona, la Clota, and Montbau, which have the lowest levels of opportunities per day. Surrounding them are other areas with a slower pace, such as several areas of Horta Guinardó, Nou Barris, Sants Montjuïc, Les Corts, and Sarrià.
Unlike the rental map, investors who decide to buy for investment purposes find a broad environment with a greater probability of closing deals without long waiting periods. In less dynamic areas, they will have to carefully assess the potential of the asset, given that the overall liquidity of the neighborhood is limited.
A city with two speeds depending on the market
Comparing both maps reveals a fundamental difference. In terms of rentals, activity is extremely concentrated in very few areas. Only a few neighborhoods account for the bulk of the movement. In contrast, in the sales market, activity is spread across many more neighborhoods, forming a dynamic “almond” shape that clearly extends beyond the center and projects outwards to different parts of the city.
Barcelona does not offer a single interpretation of the market, but two. Understanding what it means for a neighborhood to generate many or few opportunities in a day allows for more informed choices and better adjustment of any real estate investment decision.

Virginia Pérez