Real estate investment opportunities in Madrid: the neighbourhoods with the highest turnover in sales and rentals
Every 24 hours, Madrid's real estate market incorporates new investment opportunities, both for rent and for sale. Observing this flow on a map, neighbourhood by neighbourhood, allows us to understand something that prices alone do not show: where the market really moves and where it does so at a different pace.
The maps produced by the Accumin Intelligence team do not reflect values, but rather the frequency of asset appearance. And that frequency is a direct signal of liquidity, absorption and ease of future exit, three key variables for any investor who wants to reduce the temporary risk of their operation.
Three neighbourhoods where the market does not stop
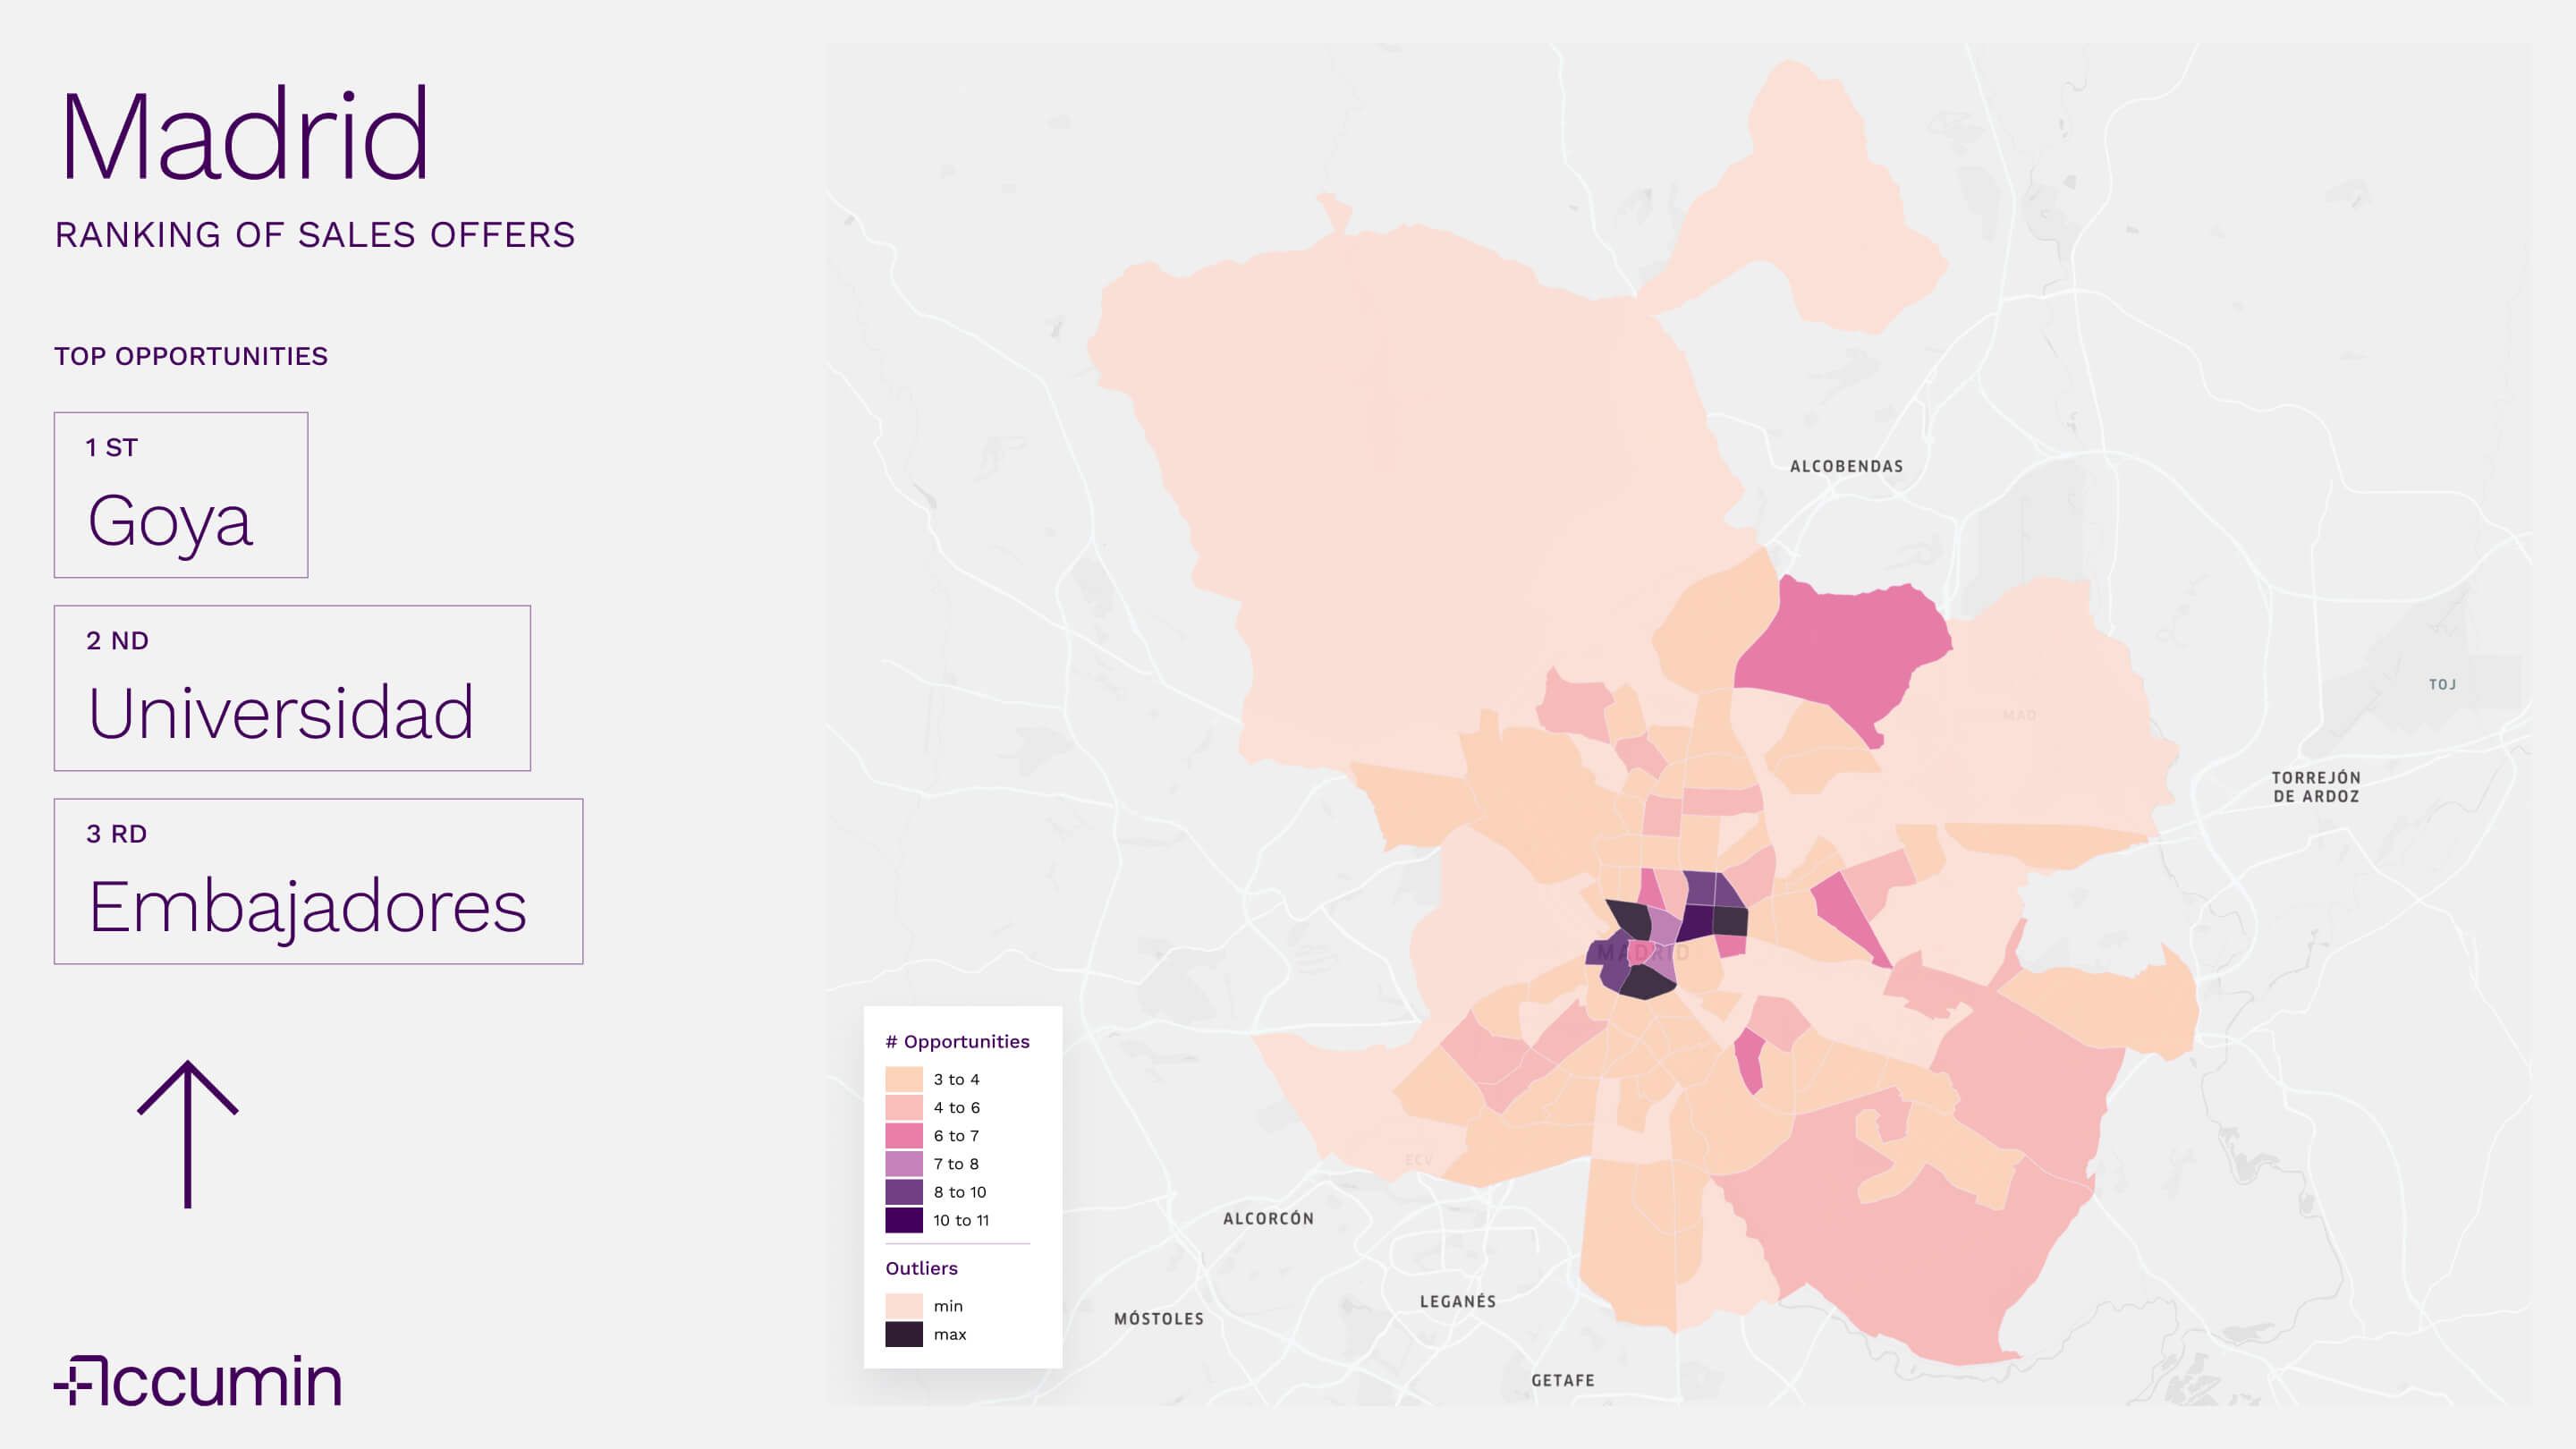
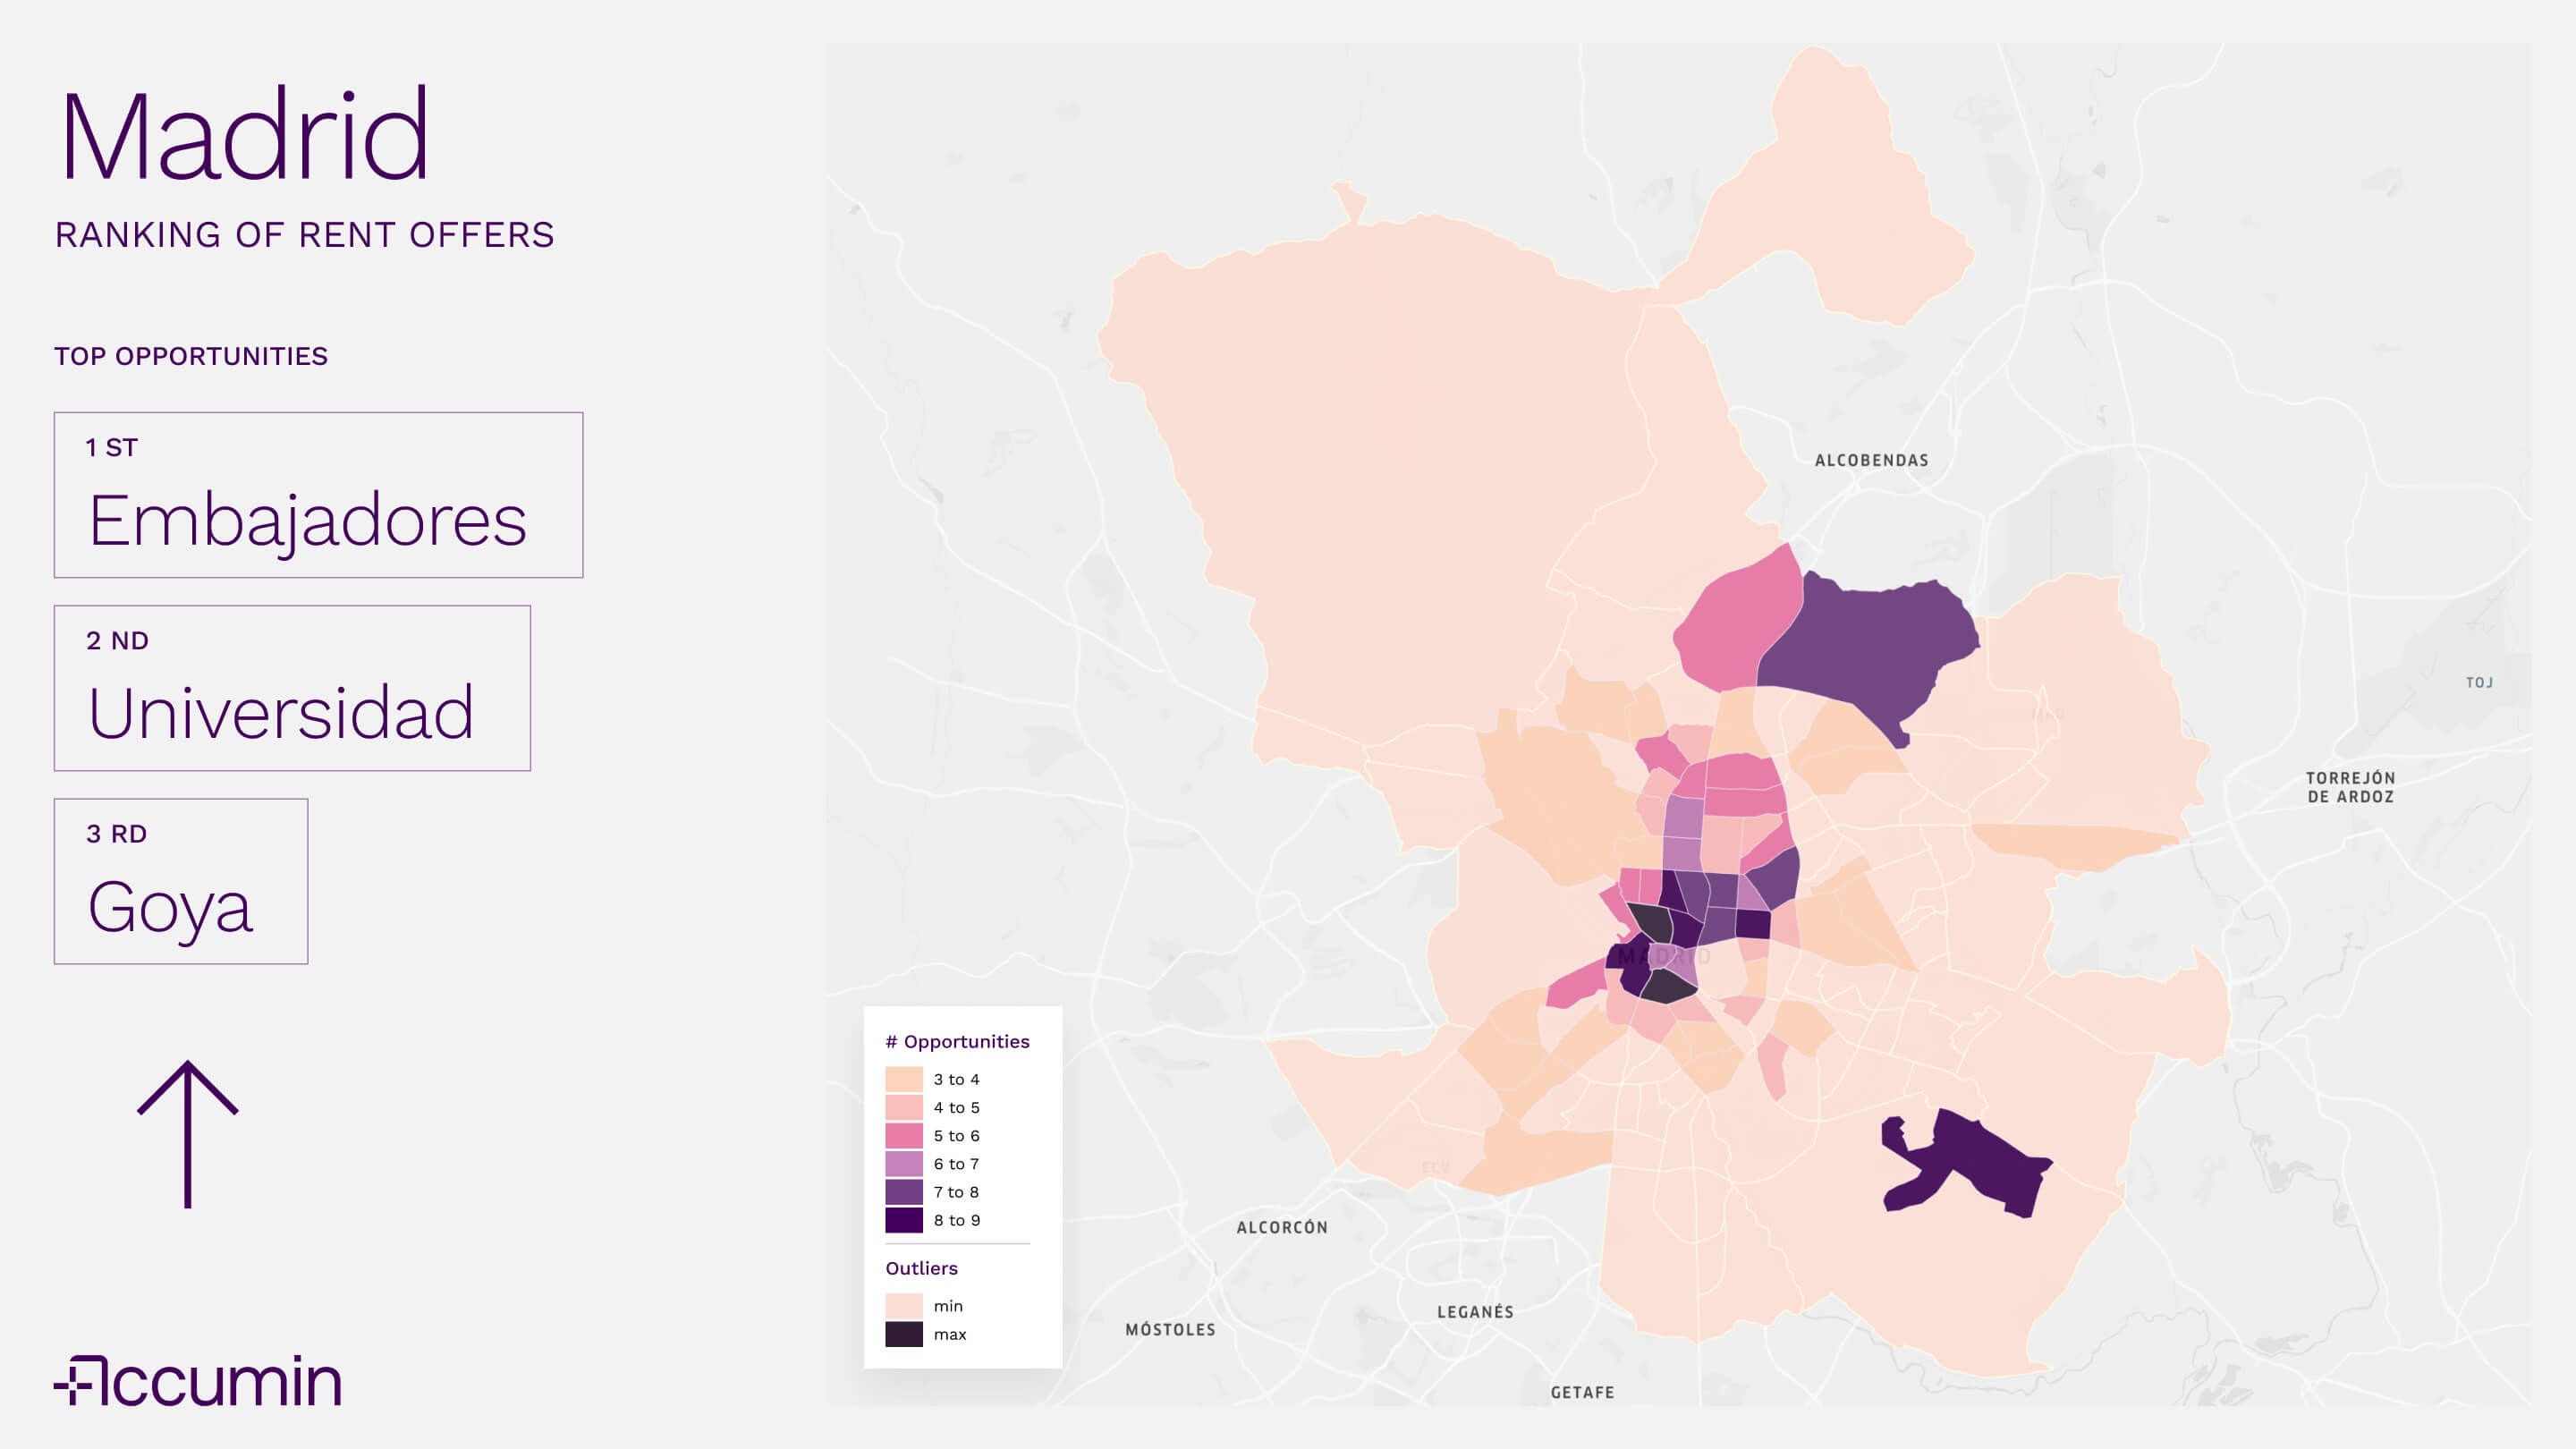
The most relevant thing is that the three most active neighbourhoods coincide in both markets. Goya, Universidad and Embajadores appear, although in different order, as the neighbourhoods with the highest number of opportunities for both rental and sale.
That they are repeated is no coincidence. Embajadores combines centrality, high residential density, a mix of typologies and a constant demand. That generates natural rotation: there is always product coming in and out.
Universidad sustains its intensity by a similar logic, but even more marked by mobility: rental housing with high turnover, repositioning of assets and a very liquid market when attractive products come out.
Goya also maintains a continuous flow because it concentrates solvent demand and a "deep market". Most of the buildings in this neighbourhood are residential homes, which is why it is considered one of the most populated neighbourhoods in the capital.
What we can differentiate between the two maps is that the neighbourhoods with the highest number of rental opportunities with respect to sales are expanded. Trafalgar, Justicia, Palacio and Ensanche de Vallecas are coloured with the darkest shades of purple.
Neighbourhoods with fewer rental opportunities: low turnover and stable market
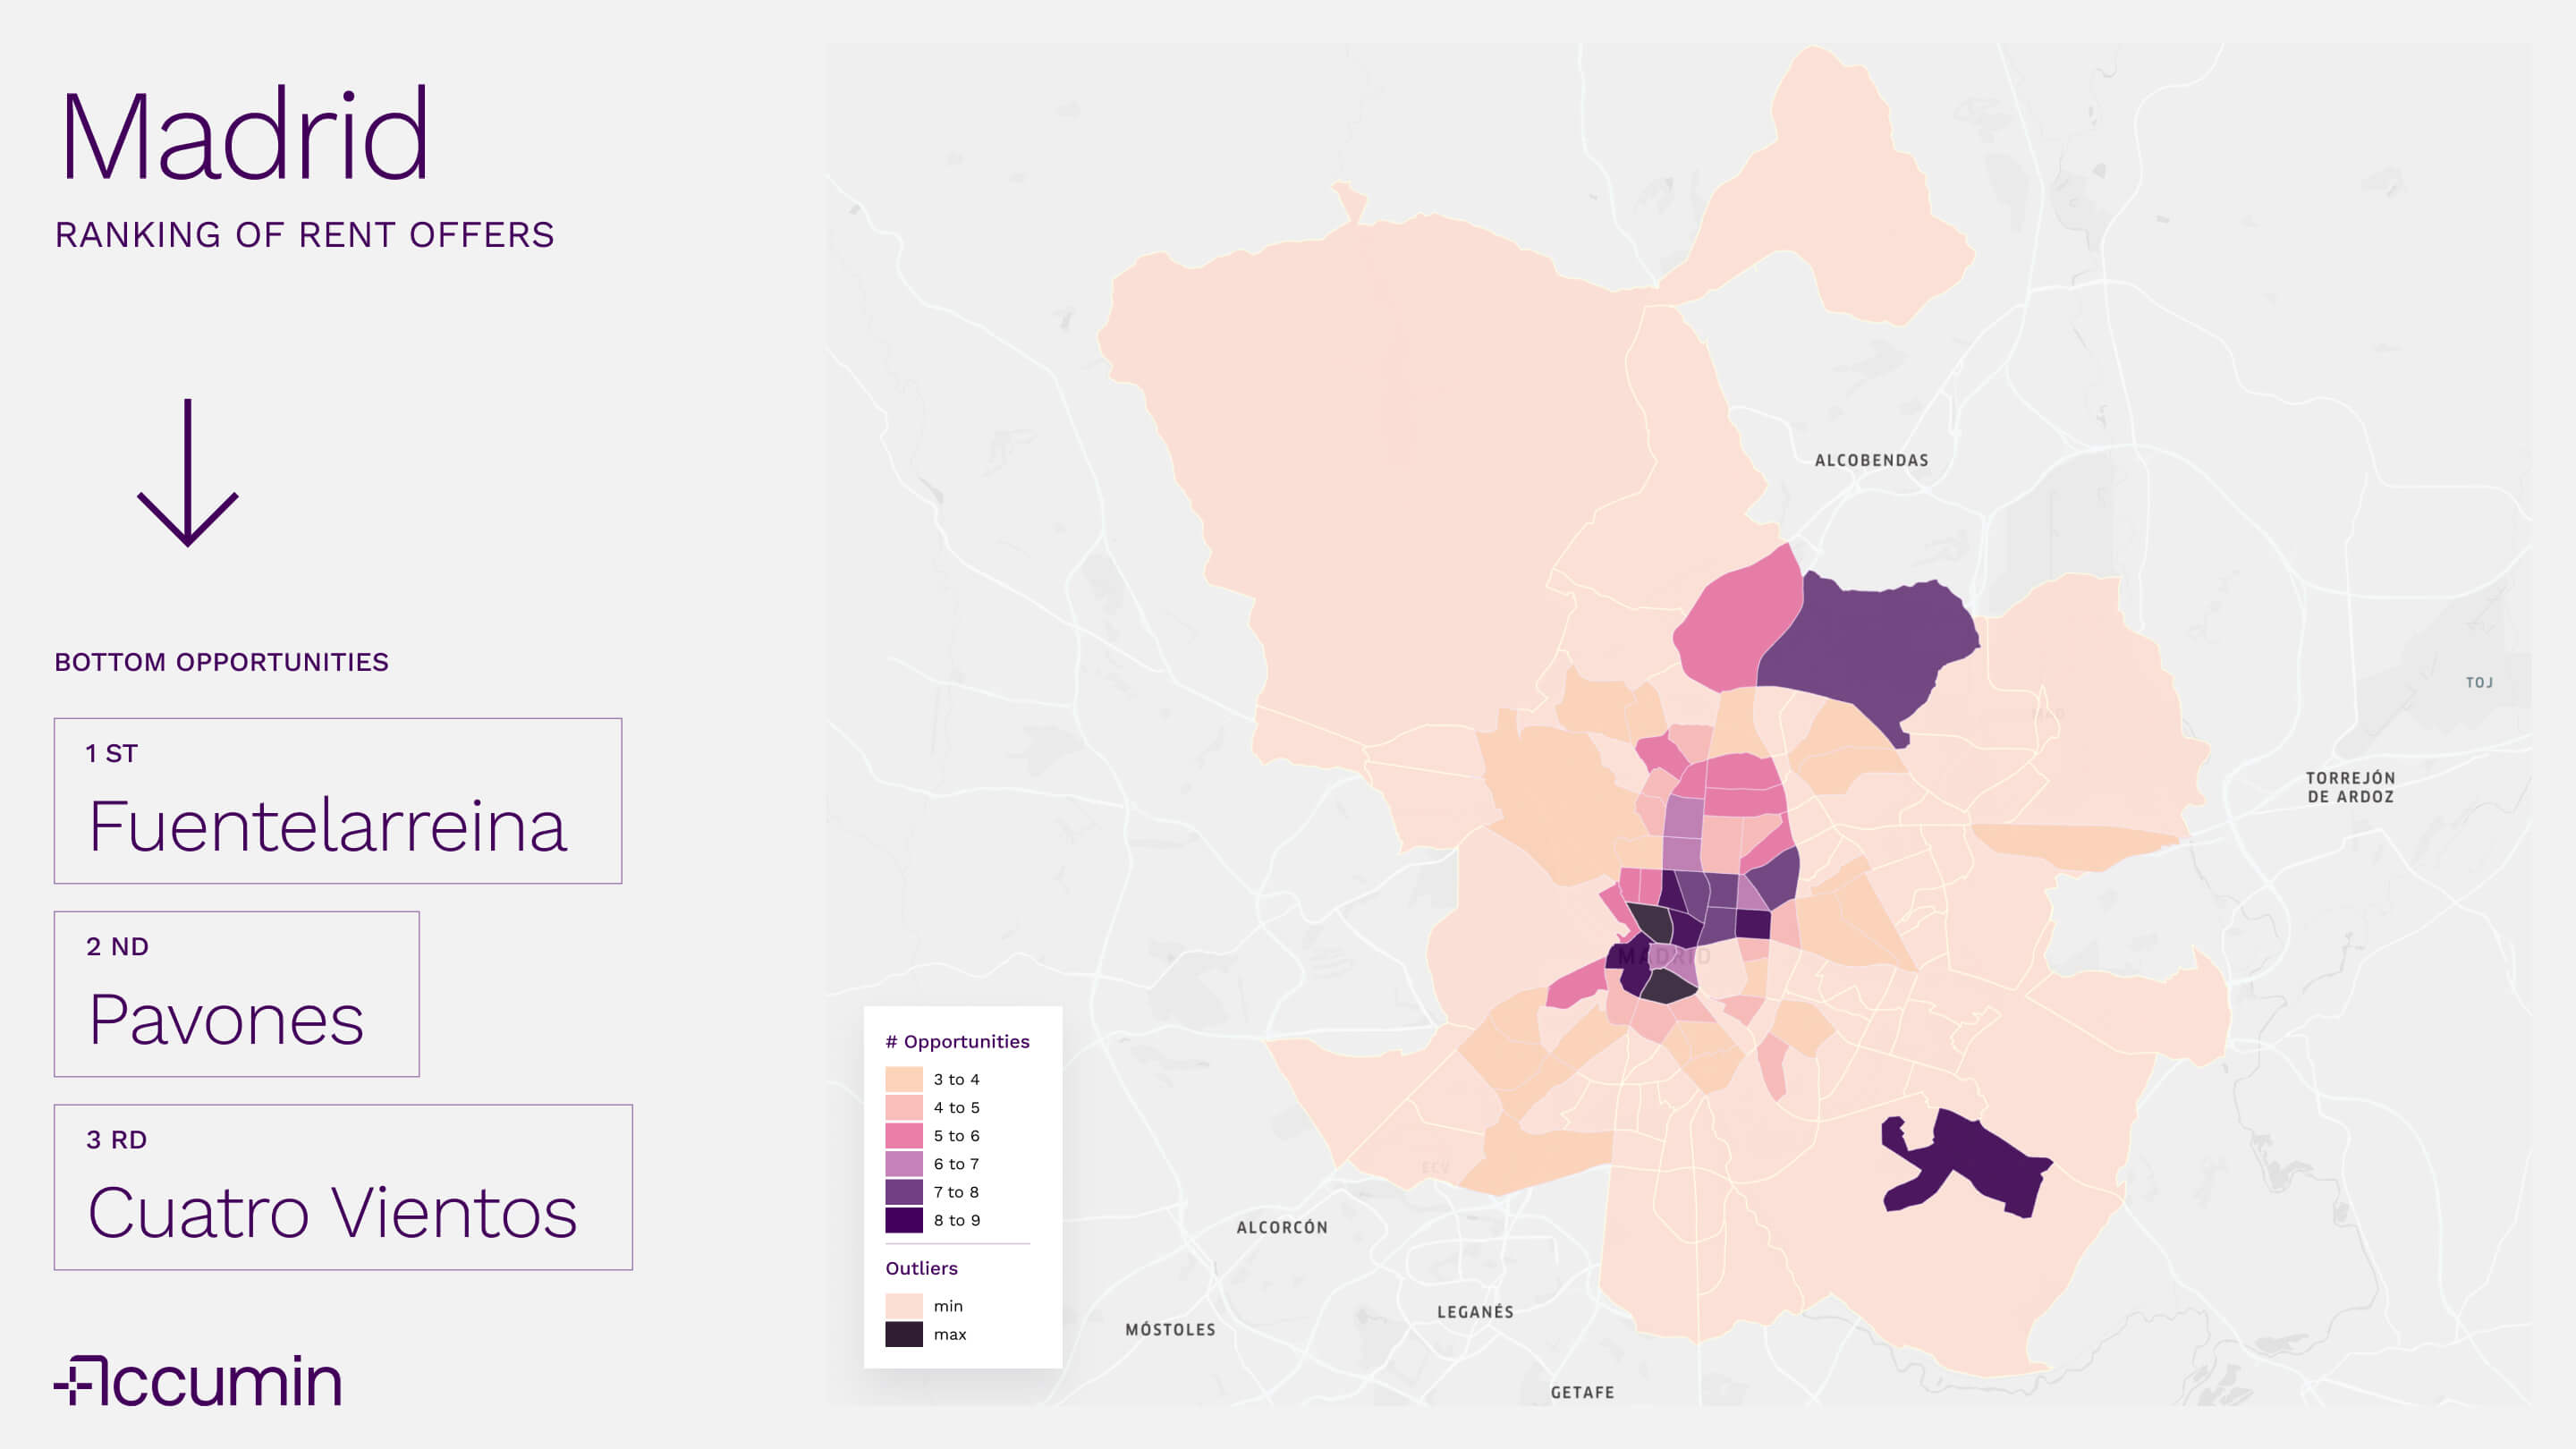
At the opposite end of the rent, the neighbourhoods with the fewest opportunities are Fuentelarreina, Pavones and Cuatro Vientos. Here the pattern changes: it is not a matter of one-off demand, but of urban structure and stock.
In Fuentelarreina, the low density and stable residential character are important, with less rotation of the park. Pavones responds to a similar logic, although in a different context. It is a consolidated residential neighbourhood, away from the major centres of daily demand, where renting exists, but does not generate a constant flow of new entrants to the market.
And Cuatro Vientos is influenced by the environment of large infrastructures and less residential uses (more open spaces and facilities), which limits the number of assets available and, therefore, the daily flow of new opportunities.
On the map, moreover, the lighter yellow extends to limited peripheral areas with a quiet residential profile or with lower density.
For the investor, these areas do not mean "bad market", but a market with less turnover: it is more difficult to see new opportunities every day, and the strategy depends more on the specific asset than on the dynamics of the neighbourhood.
Areas with the lowest turnover in real estate sales
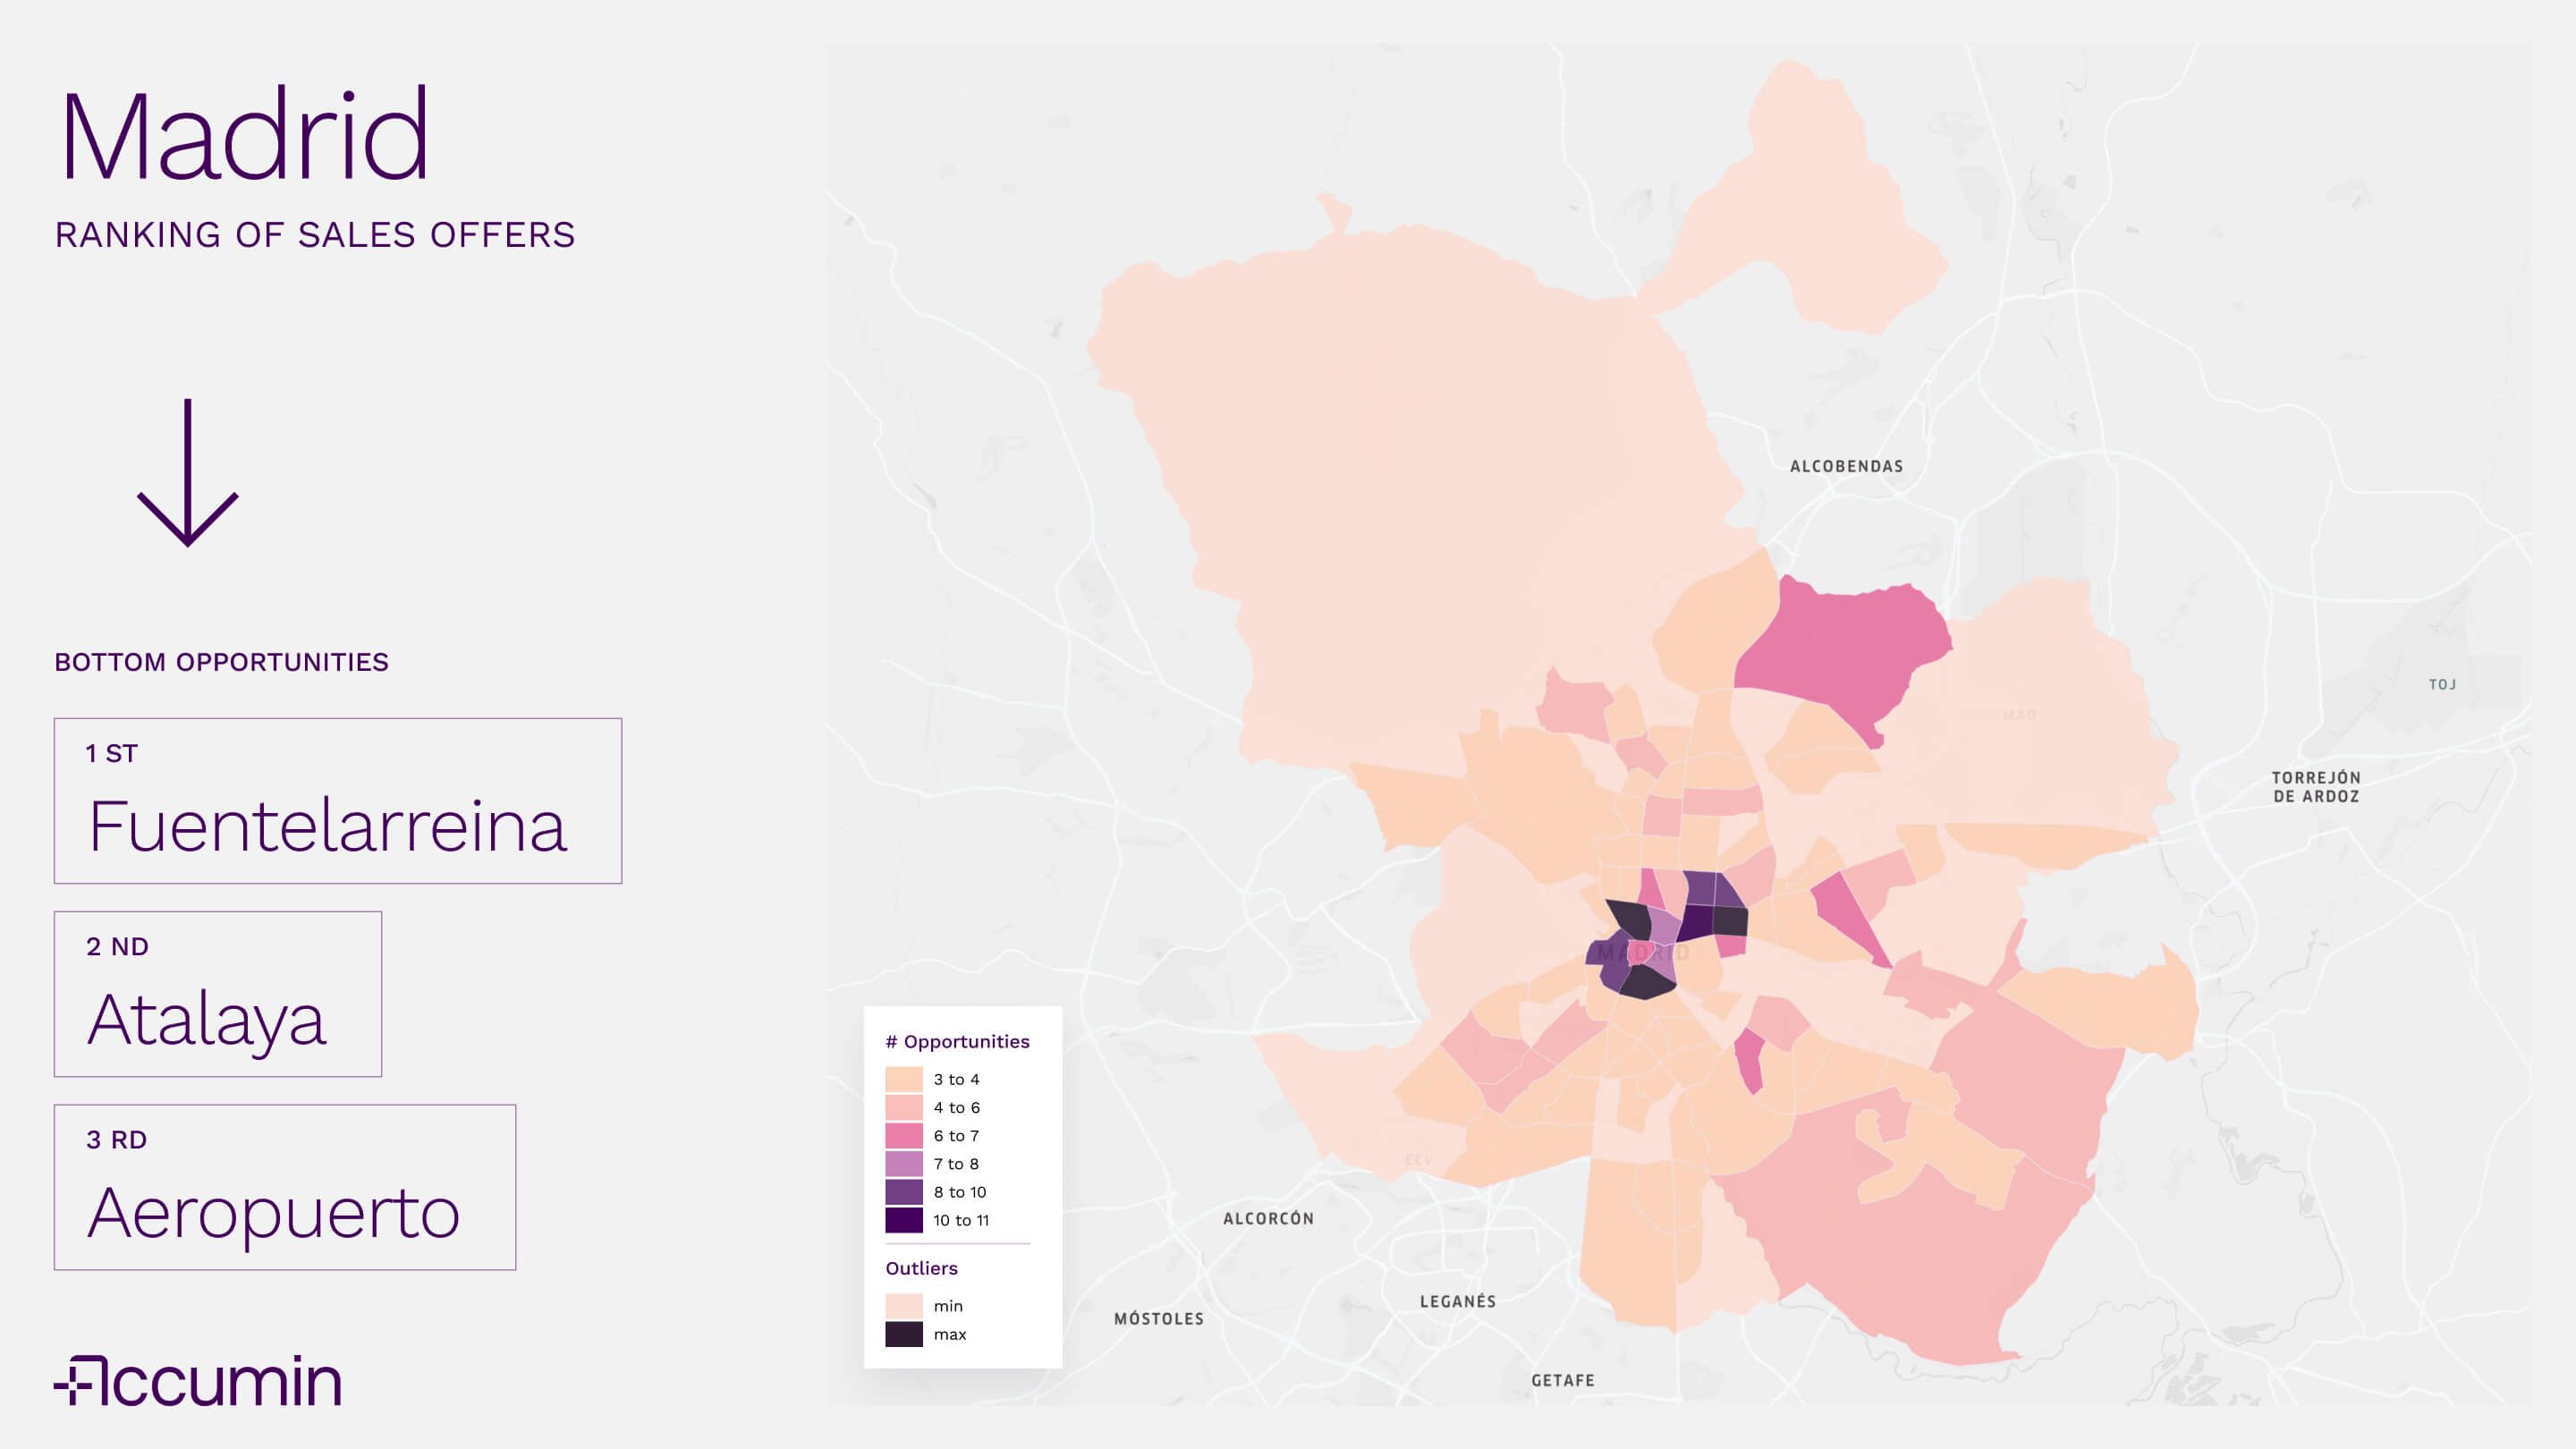
On the map of sales, Fuentelarreina, Atalaya and Aeropuerto are among the neighbourhoods with the lowest daily appearance of new opportunities.
Here the explanation is even more direct: in these areas the flow of sales is lower because the weight of residential housing is more limited or stable, and urban uses that "compete" with residential come into play.
Fuentelarreina repeats for the same reason: low density, heritage market and low turnover. Atalaya is the smallest neighbourhood in Madrid. It moves in a similar logic, with a park that changes little hands and where there is no daily trickle of new opportunities. And in Airport, the low number of sales opportunities is linked to its current urban moment. It is a neighbourhood immersed in a regeneration process that is still under development, with municipal projects pending execution, which today limits the rotation of the residential stock and reduces the flow of new opportunities for sale.
On the map, the lightest areas are in the majority and coincide with areas where the residential fabric is less intense or more stable. For the investor, this usually implies longer maturities and lower average liquidity, although sometimes very interesting one-off opportunities appear.
Investing Beyond Price: How to Read Real Estate Market Liquidity
Reading the market from the frequency with which opportunities appear changes the usual logic of analysis. It does not talk about fashions or still photos, but about the real capacity of the market to absorb assets continuously.
In Madrid, neighbourhoods that concentrate opportunities every 24 hours not only reflect current demand, but also an urban and residential structure that facilitates rotation, reduces the risk of blockage and allows strategies to be adjusted with greater room for manoeuvre. On the other hand, areas with lower flow force us to think about investment from the long term, where the value does not depend so much on the market as on the asset and the urban moment in which it is located.
For the investor, this reading does not serve to choose "the best neighbourhood", but to align expectations, deadlines and risk. Because investing is not only about guessing where to enter but also knowing how long you are willing to wait to leave.

Virginia Pérez